View test results
After you run a test, NeoLoad Web tracks it on the Results page and updates the data as the test runs. Use this page to check whether the run met its targets, find the point where response times started to degrade, and confirm that a fix worked before you release it.
Every result opens on the Overview tab, which summarizes the run. Go to one of the other tabs when you need more detail:
-
The Values tab provides detailed performance metrics on transactions, pages, requests, actions, and counters.
-
The Events tab lists the alerts, errors, and objectives that the test run triggered.
-
The SLAs tab shows whether the test run met the Service Level Agreements you defined.
-
The Dashboards tab lists every dashboard that includes this result.
-
The Logs tab helps you diagnose a run that failed.
Test run header
The header stays visible on every tab and shows the following information about the run:
-
Status: The test status.
-
Test: The name and link to the test.
-
Started: When the test run started.
-
Duration: How long the test run took from start to finish.
-
VUs: The maximum number of virtual users (VUs) active during the test run.
-
Scenario: The scenario used for the test.
-
Project: The project name.
-
Zone: The zone where the test ran.
Overview tab
The Overview tab answers the first questions you have about a run: did it pass, and how did it perform? The summary at the top gives you the totals, and the Metrics charts below plot them across the run.
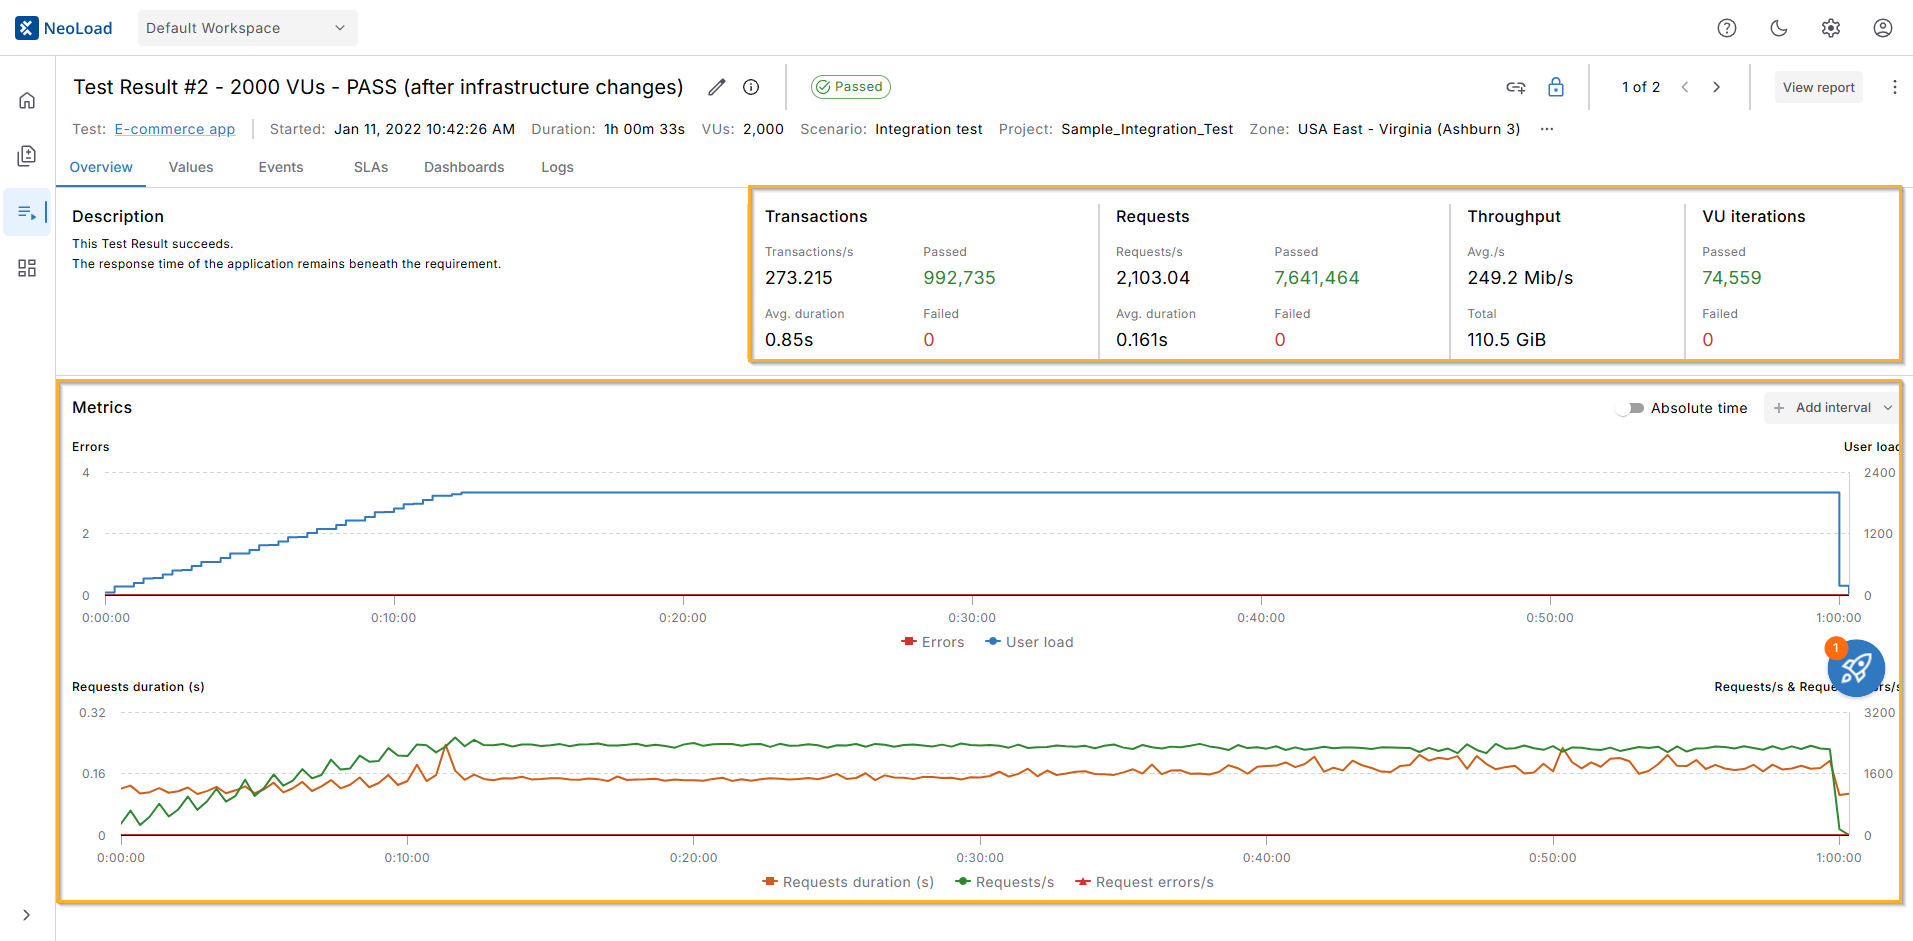
Click to enlarge: The summary and Metrics charts in the Overview tab.
The summary covers the following:
-
Description: Notes you add to the result. Use it to record what changed in this run, such as an infrastructure change or a new build.
-
Transactions: Transactions per second, their average duration, and how many passed or failed.
-
Requests: Requests per second, their average duration, and how many passed or failed.
-
Throughput: The average throughput per second and the total amount of data transferred during the test.
-
VU iterations: How many virtual user iterations passed or failed.
Metrics charts
The Metrics section plots two line graphs across the length of the test run:
-
Errors and user load: Plots the number of errors against the user load, so you can see whether spikes in errors line up with increases in active virtual users.
-
Requests duration and volume: Plots the average request duration alongside requests per second and request errors per second, so you can see how request volume and errors affect response time.
To mark a specific time range for closer analysis, select + Add interval above the graphs. Check out Manage intervals to learn more.
What's