Create reports with Insights
Without good data, you can't make good decisions. If you want an objective view of your testing process from production to release, then qTest Insights is a great place for you to get these numbers.
With qTest Insights, you can access powerful data tools, such as:
-
Cross-project analysis dashboards and reports
-
Raw qTest data that you can use to create custom reports
-
Custom dashboards that help with side-by-side data visualization
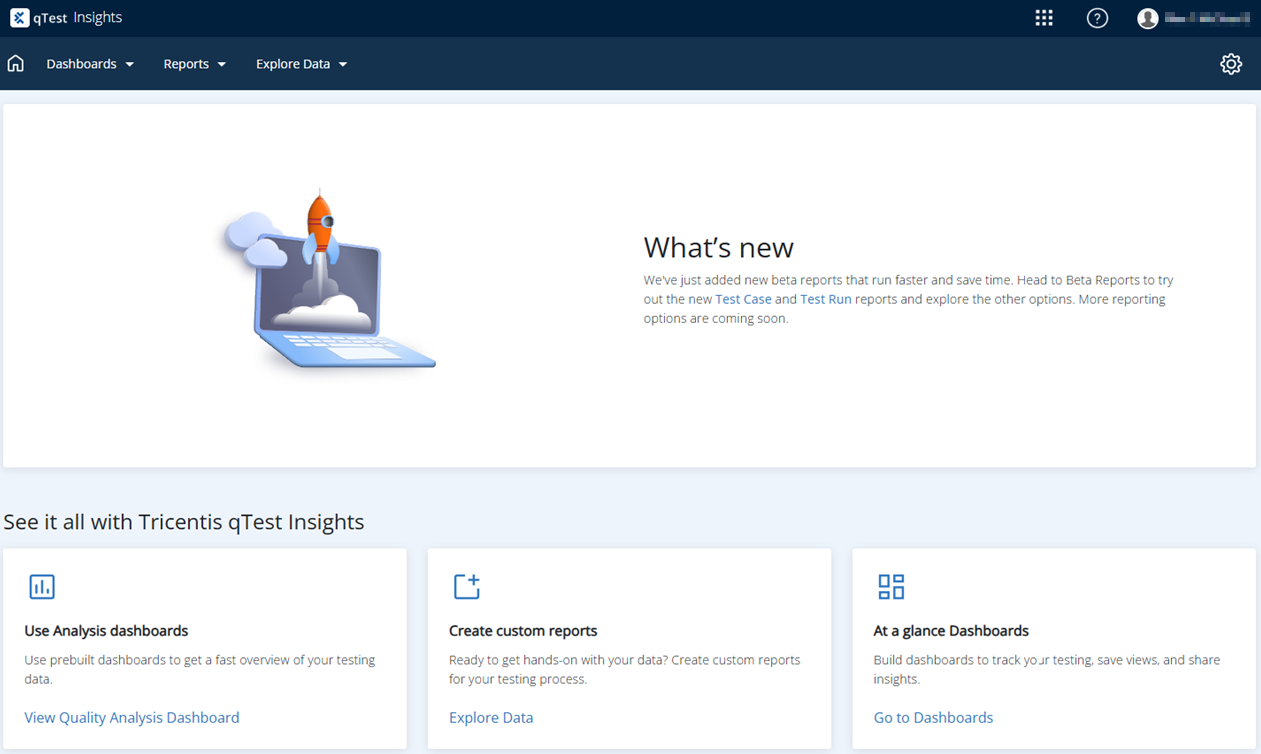
You can get to all of your reporting needs from the Insights home page.
Before you start
Before you can view or edit Insights, you need to ask your Site Administrator to add you to the appropriate User Group:
-
To access Insights with view-only capabilities, you need to be in the qTest Insights Viewer group.
-
To access and edit Insights, you need to be in qTest Insights Editor group.
Dashboards
The Dashboards menu offers several options for data visualization, from standard analysis dashboards to custom dashboards.
To get a quick overview of your process, use one of our cross-project analysis dashboards: Quality, Coverage, and Velocity. Each dashboard consists of charts for data visualization, above a data table that contains more detailed information. For more information on how you can use analysis dashboards, check out Use Analysis dashboards.
If you want something more specific, you can also create custom dashboards from a wide selection of charts. Use this feature to organize your data into panels and tabs, which can report high-level data at regular intervals. For more information on how you can manage information with dashboards, check out Create and use dashboards.
Reports
The Report menu provides several prebuilt reports that give you data on your portfolio, defects, and planned vs. executed tests. For more information about the data you can get with prebuilt reports, check out Report Gallery.
You can also manage and schedule any reports you already created from Explore Data here. For more information about how to work with saved reports, check out manage and share saved reports.
Explore Data
The Explore Data tab provides raw qTest data to generate and view charts. Use this feature to find a multitude of viewable data that you can narrow down and sort with filters and formulas to create custom reports.
For more information on how you can use Explore Data, check out Create custom reports.
Settings
Select the Settings ![]() gear to manage certain Insights functions for Jira Insights Settings and Portfolio Settings. For example, if you want to adjust settings for prebuilt portfolio reports, or you want to set up reporting with Jira fields, you can do that from Settings.
gear to manage certain Insights functions for Jira Insights Settings and Portfolio Settings. For example, if you want to adjust settings for prebuilt portfolio reports, or you want to set up reporting with Jira fields, you can do that from Settings.
For more information about what settings are available, check out adjust settings in Insights.