Use Analysis dashboards
With qTest Insights, you get access to several dashboards that you can use to analyze your testing across multiple criteria. Each dashboard consists of charts for data visualization, above a granular analyzed data table with more detailed information.
From the Dashboardsmenu, you can access the following analysis dashboards:
-
Quality Analysis: View your overall testing outcomes, such as passed vs. failed tests and defects created.
-
Coverage Analysis: Determine how well your requirements are being covered by test cases and test runs.
-
Velocity Analysis: Estimate your team's progress, as well as their remaining workload.
You can't edit the content of these dashboards, but you can apply and save filters to them.
Quality Analysis
Are your test runs passing or failing? How many defects are you catching? How many are you closing? Use the Quality Analysis dashboard to get an overview of your testing outcomes.
To access the Quality Analysis dashboard, select Quality from the Analysis dropdown.
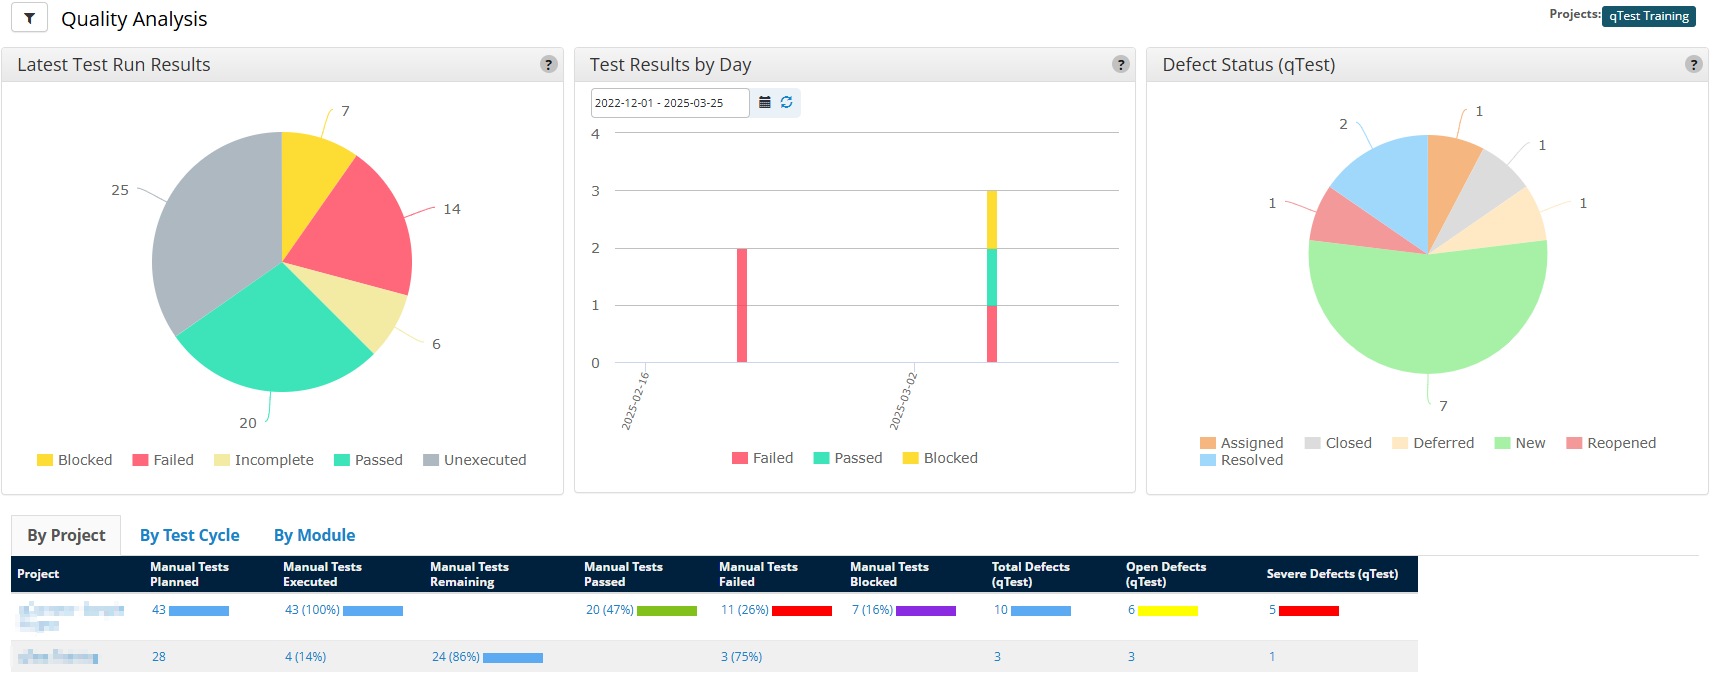
The Quality Analysis charts and analyzed data table display the status of test runs and defects, which you can organize By Project, By Test Cycle, or By Module.
On the Quality Analysis page, you can find the following charts:
- Latest Test Run Results: A pie chart covering the results from the most recent test run of each included test case.
-
Test Results by Day: A bar chart breakdown of test run results on each day.
-
Defect Status: A pie chart that contains the distribution of defects by status.
Use the tabs at the bottom of the page to view the analyzed data table broken down By Project, By Test Cycle, or By Module. You can select any of the data in these tables to open a drill-down view.
|
Column |
Description |
|---|---|
|
Tests Planned |
Test runs created in the system. Manual and automated test runs are stored in separate columns. |
|
Tests Executed |
Completed tests. Manual and automated test runs are stored in separate columns. |
| Tests Remaining | Test runs created but not executed. Manual and automated test runs are stored in separate columns. |
| Tests Passed | Completed test runs with a status of Passed. Manual and automated test runs are stored in separate columns. |
| Tests Failed | Completed test runs with a status of Failed. Manual and automated test runs are stored in separate columns. |
|
Tests Blocked |
Manual and automated test runs are stored in separate columns. |
|
Total Defects |
The total amount of defects created from the test runs. Defects native to qTest and defects linked from an external ALM are stored in separate columns. |
| Open Defects (qTest) |
The amount of qTest defects listed as either New, Reopened, or Assigned. |
| Severe Defects (qTest) |
The amount of qTest defects with a severity of Major or Fatal. |
Coverage Analysis
You've got requirements, and you've got tests, but do you have coherency in your coverage? The Coverage Analysis dashboard helps you determine how well you are covering your requirements with your overall testing.
To access the Coverage Analysis dashboard, select Coverage from the Analysis dropdown.
The Coverage Analysis charts and analyzed data table display how well your requirements are covered by your testing.
On the Coverage Analysis dashboard, you can find the following charts:
-
Requirements Test Run Coverage: A heat map to illustrate where test runs are generally passing or failing. The size of each box is based on the number of test runs, and the color of the box is based on the number of failed runs. Dark green represents the lowest number of failures, and bright red represents the highest number.
-
Requirements Run Results: A pie chart that displays results from the most recent test runs of each test case that covers the filtered requirements.
Below the charts, you can find the Coverage analyzed data table. You can filter this table according to Test Type by selecting Manual, Automated, or Both.
The Coverage table lists the test cases that are connected to each requirement, along with the testing results and number of defects.
This table offers different information in accordance with the qTest features you use in your testing process. Depending on your setup, you can find the following information:
|
Column |
Description |
|---|---|
| Creator | The user who created the test case. |
| Test Case Type | Whether the test case was Manual or Automatic. |
| Test Steps | How many test steps are in the associated test cases and requirements. |
| Total Test Runs | How many test runs have been completed for the associated test cases and requirements. |
| Total Testing Time | The total amount of time the testers have recorded in their |
| Last Run Date | The date of the most recent test run completed for the associated test cases and requirements. |
| Last Run Result | The result of the most recent test run completed for the associated test case. |
| Total Passed | The total amount of test runs completed for the test case or requirement that have passed. |
| Total Failed | The total amount of test runs completed for the test case or requirement that have failed. |
|
Explorer Sessions |
The number of Explorer sessions associated with a specific test case and requirement. To see this statistic, you must have an Explorer session linked to the associated test runs. |
|
Explorer Duration |
Total time spent in Explorer sessions associated to a specific test case and requirement. To see this statistic, you must have an Explorer session linked to the associated test runs. |
|
Total Defects |
The total amount of defects associated with the requirement or test case. Defects native to qTest and defects linked from an external ALM are stored in separate columns. |
|
Open Defects (qTest) |
The amount of qTest defects listed as either New, Reopened, or Assigned. |
|
Severe Defects (qTest) |
The amount of qTest defects with a severity of Major or Fatal. |
Velocity Analysis
Do you know how close you are to your release? We know you have a countdown on your calendar, but we think you need something a little more accurate. The Velocity Analysis dashboard can help calculate how fast your team is progressing, as well as help estimate the remaining workload.
To access the Velocity Analysis dashboard , select Velocity from the Analysis dropdown.
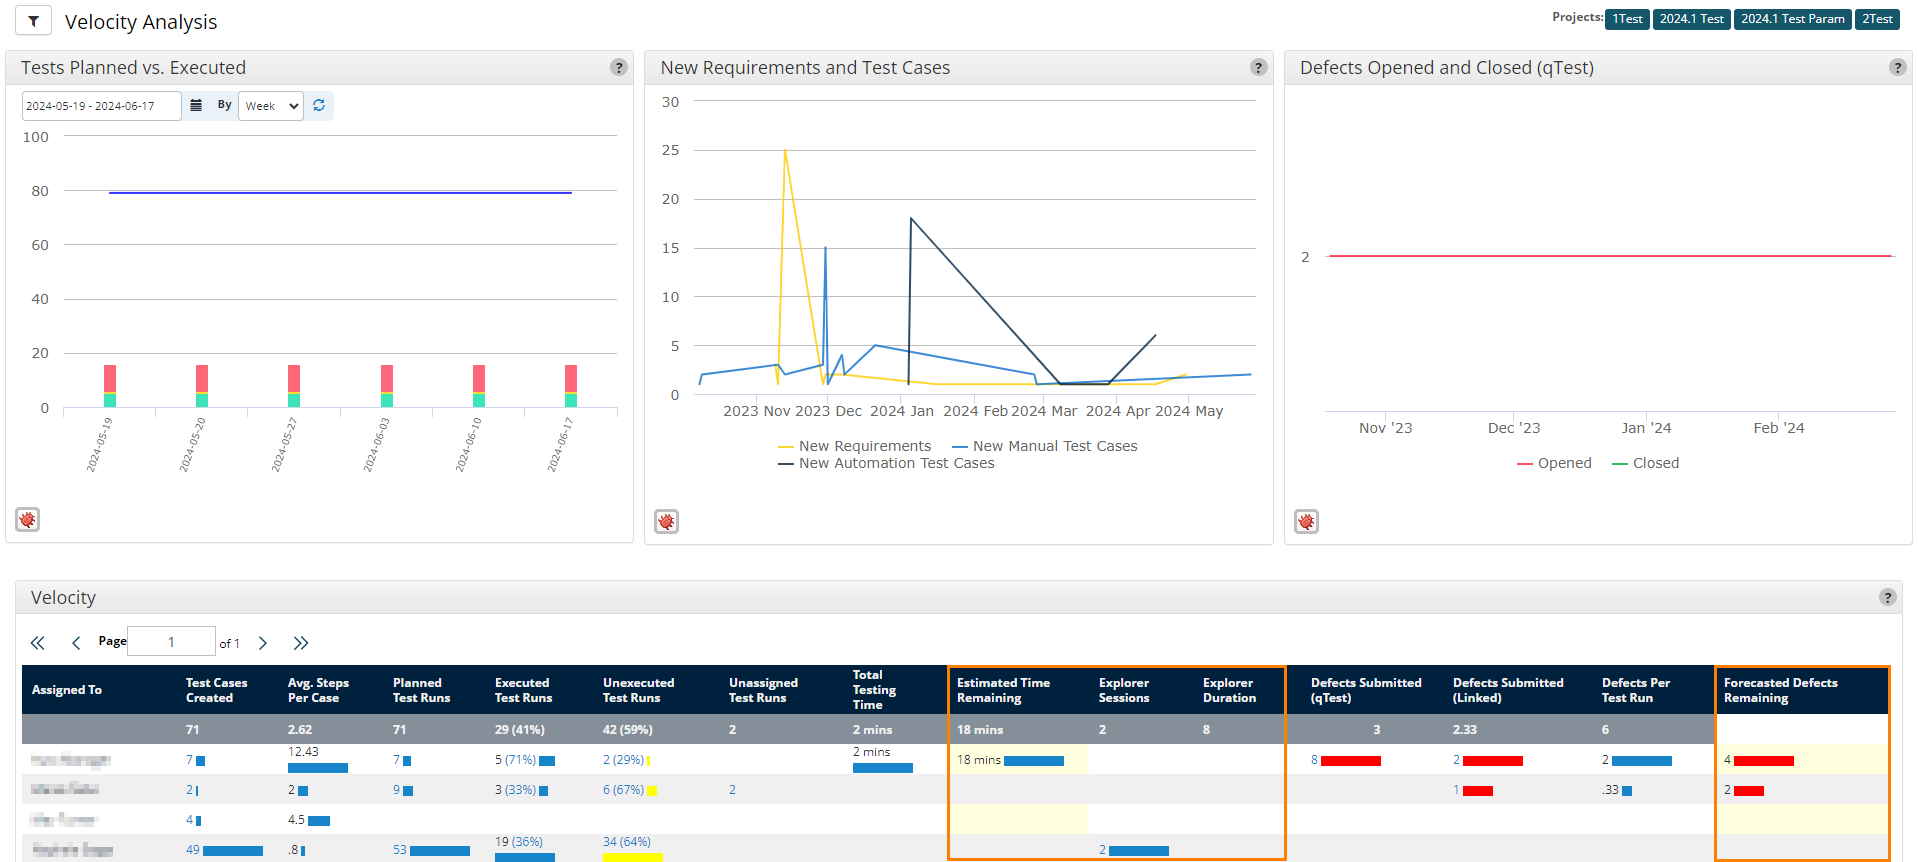
The Velocity Analysis charts and analyzed data table display the amount of remaining work.
On the Velocity Analysis page, you can find the following charts:
-
Test Planned vs. Executed: A line chart that displays the number of planned test runs, alongside a bar chart that displays cumulative results by day for completed test runs.
You can select a custom date range for the data you want to view in this chart. If you select multiple releases in the
 Filter, the chart displays the earliest start date and the latest end date for the releases you selected.
-
New Requirements and Test Cases: A line chart that displays the number of requirements and test cases added per day. Test cases are categorized into manual and automated.
-
Defects Opened and Closed (qTest): A line chart that displays the number of qTest defects opened and closed per day.
The Velocity analyzed data table breaks down activities and results for each individual tester. You can select any of the datapoints in this table to open a drill-down view.
This table offers different information in accordance with the qTest features you use in your testing process. Depending on your setup, you can find the following information:
|
Column |
Description |
|---|---|
| Assigned to | The tester that the data in the table is associated with. |
| Test Cases Created | The total amount of test cases created. |
| Avg. Steps Per Case | The average number of steps in each test case. |
| Planned Test Runs | The total amount of test runs created. |
| Executed Test Runs | The amount of test runs completed. |
| Unexecuted Test Runs | The amount of incomplete test runs remaining. |
| Unassigned Test Runs | The amount of created test runs not assigned to a tester. |
| Total Testing Time | The amount of recorded time spent testing so far. |
| Estimated Time Remaining | An estimate of the amount of time the tester will need to complete their work, based on the time the tester spent on each test step and the number of test steps that remain. |
|
Explorer Sessions |
The number of Explorer sessions associated with a specific test case and requirement. To see this statistic, you must have an Explorer session linked to the associated test runs. |
|
Explorer Duration |
Total time spent in Explorer sessions associated to a specific test case and requirement. To see this statistic, you must have an Explorer session linked to the associated test runs. |
|
Defects Submitted |
The amount of defects submitted by the tester. Defects native to qTest and defects linked from an external ALM are stored in separate columns. |
|
Defects Per Test Run |
The average amount of defects submitted per test run by the user. |
| Forecasted Defects Remaining | An estimate how many defects the tester will find, based on the number of defects the tester found per test run and the number of test runs that remain. |
What's next
Happy with the data you've got? Learn how you can share with collaborators.
Want something a little more specific? Learn how you can create custom dashboards.