Data Grid features
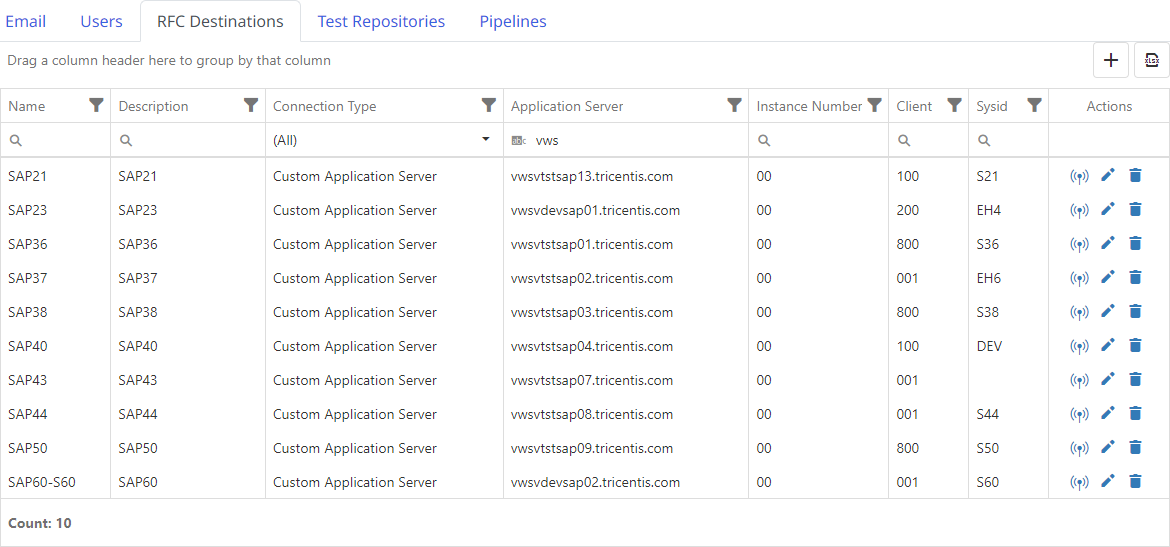
The App Cockpit, Apps Monitor, Contacts, Guided Configuration, Impact Analyses, Logs, Projects, Reports, Service Status, Show as table and Workspaces screens use a Data Grid to display their data in a table format, as shown below.
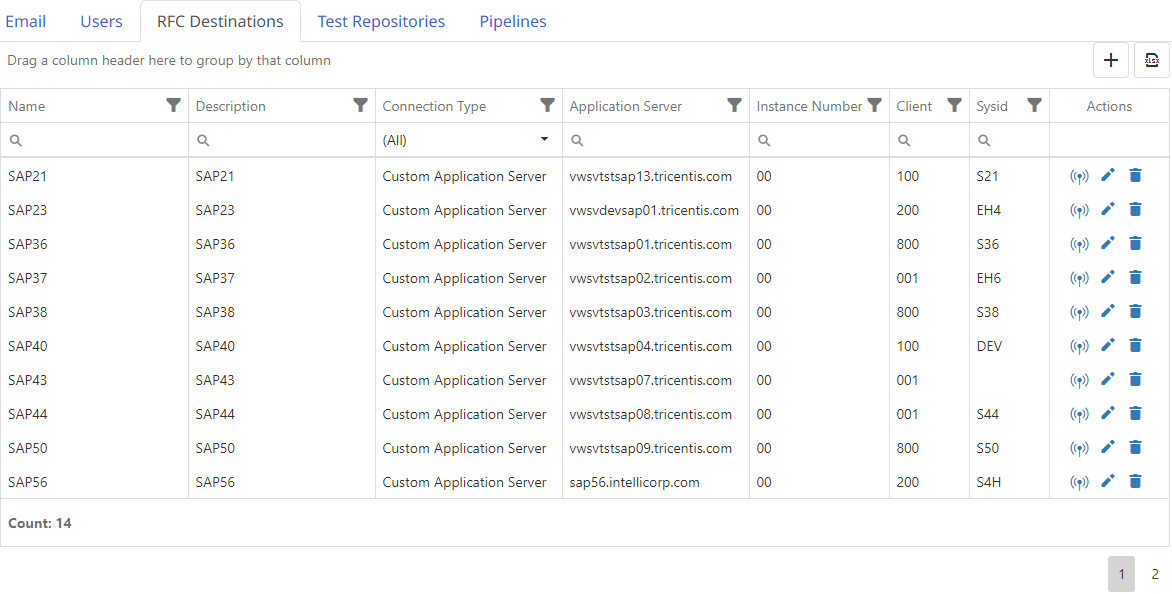
The Data Grid has several features that allow the data to be sorted, filtered, searched, grouped or exported to Excel.
Navigate the Data Grid
The Count label displays the number of items in the Data Grid. Use the buttons in the bottom right-hand corner to navigate between pages.
Resize columns
To resize columns, drag the dividers in the column headings.
Sort the Data Grid
Click a column in the Data Grid to sort the data by that column in ascending order. The column is marked with  .
.
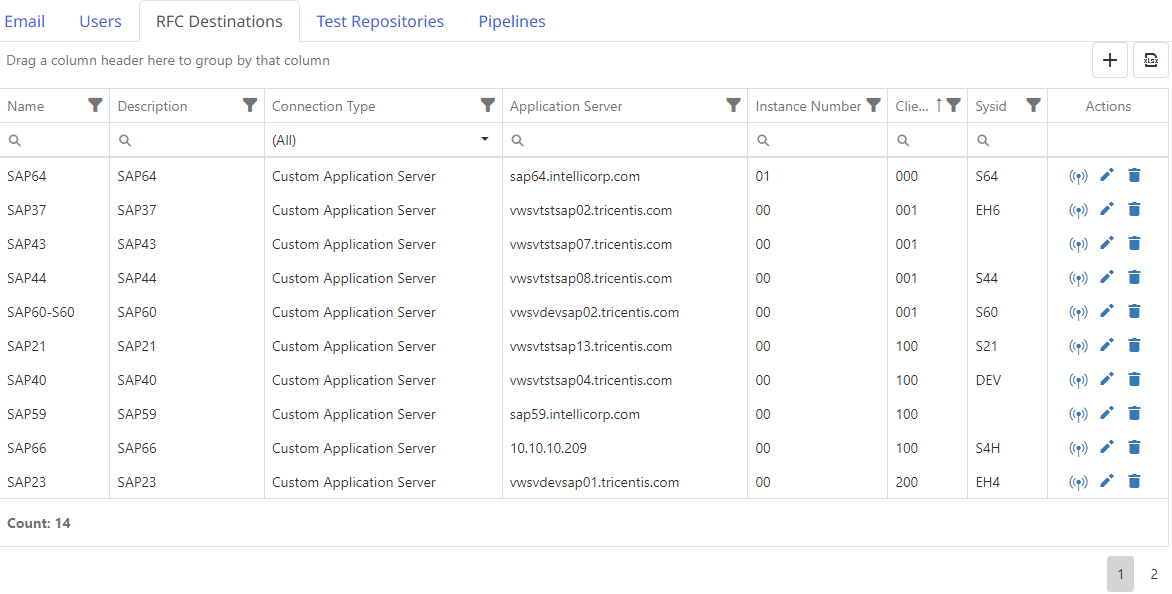
Click the column again to sort in descending order. To clear sorting, right-click the column and select Clear Sorting.
Filter the Data Grid
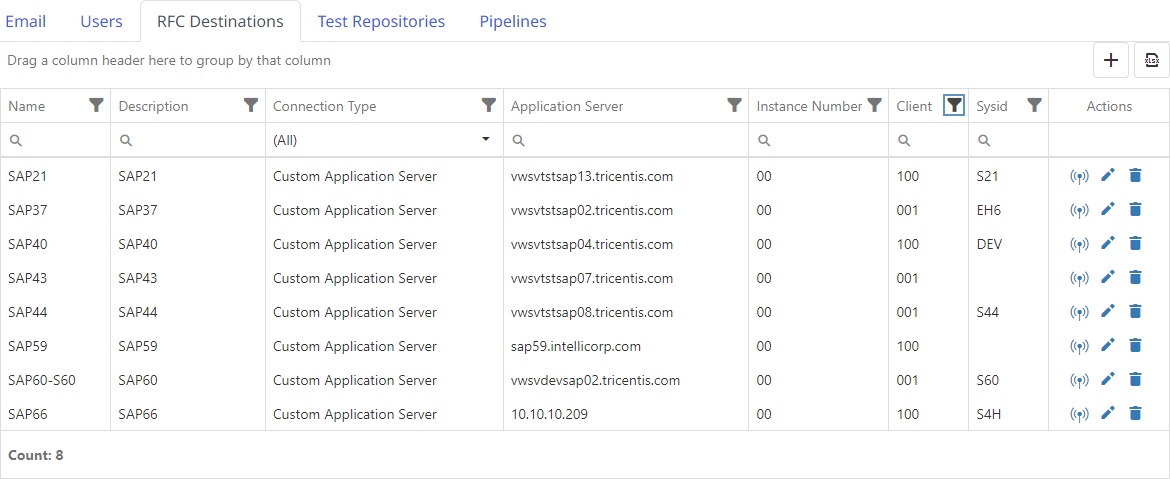
Click the  icon a column heading to filter the Data Grid by the data in that column. A dialog displays the column’s distinct values.
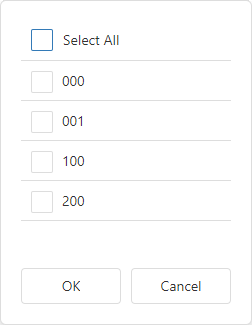
Select one or more values and click OK to apply the filter.
To remove the filter, click the  icon again, clear all the selected values and click OK.
Search the Data Grid
To search the Data Grid, click the  icon in the row underneath the column heading. A dropdown menu is displayed.
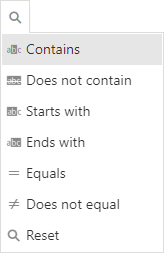
Select an operator and enter the search value in the row below the column headings.
Click  in date or time fields to select the date and time for which to search.
To remove sorting from a column, select the operator icon in the row below the column headings and choose Reset from the dropdown menu. Note that more than one column may be searched. Columns that have a known set of values (for example, the Connection Type column above) may searched by selecting a value from the dropdown list.
Group data
To group the Data Grid data by a column, drag the column header into the Drag a column here to group by that column section. Groups may be expanded in the Data Grid to display their row values.
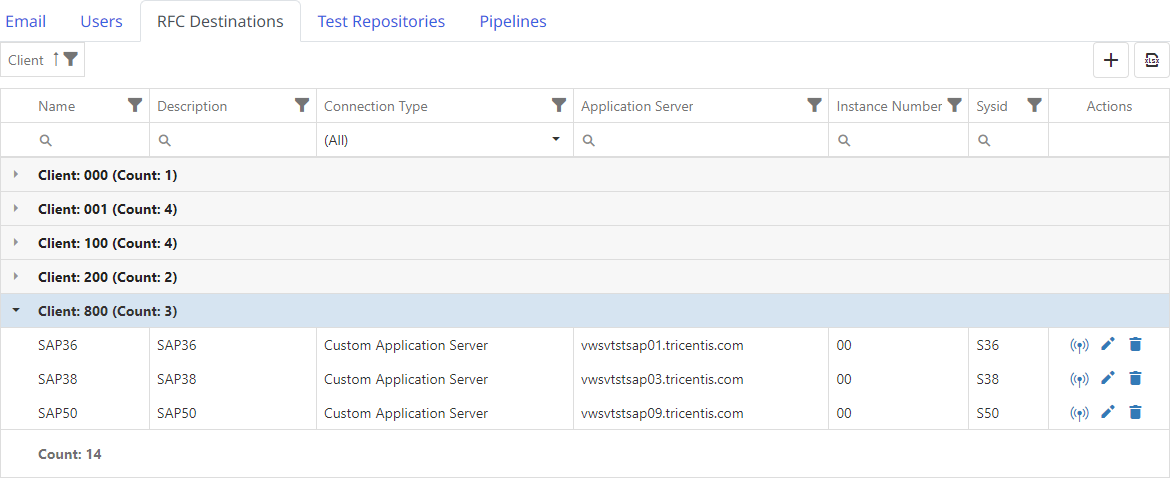
Sorting and filtering options are available for the grouped column. The Data Grid may be grouped by additional columns by dragging them into the grouping area. To remove a group, drag it back into the Data Grid from the grouping area.
Set the maximum number of rows to be displayed on a page
The Logs and Workspaces screens allow you to configure the maximum number rows that are displayed on a page. Select a number from the options displayed below the Data Grid on the left-hand side to change the configuration.
Export the Data Grid data to Excel
-
Click
 and select Export all data to Excel to export the Data Grid data to an Excel spreadsheet. Note that this is not supported for the Data Grids on the Logs or Workspaces screens.