Prebuilt reports
Want more detailed data, but not sure where to start? In the Reports menu, you can access the following kinds of prebuilt reports:
-
Defect Analysis: Analyze your development quality by comparing test run results against linked and unlinked defects.
-
Portfolio Overview: Analyze your test health with cross-project data, test run status, and Jira defect status views grouped by release or test suite.
-
Portfolio Progress: View test run status, test run progress, defect status, and defect status trends grouped by release or test suite.
-
Tests Planned vs Executed: Compare planned test goals against executed tests to review your testing progress.
Before you start
Before you can use the Portfolio Overview or Portfolio Progress reports, go to Portfolio Configuration in settings to set up your custom portfolio.
Before you can use the Test Planned vs Executed reports, go to Tests Planned vs Executed in settings to set up the report.
If you have a Jira integration, you can also configure Jira Defects in Portfolio reporting to view integrated defects in your reports.
Defect Analysis
In the Defect Analysis report, users can use both the latest test run results and defect statuses for both linked and unlinked defects to analyze the quality of development.
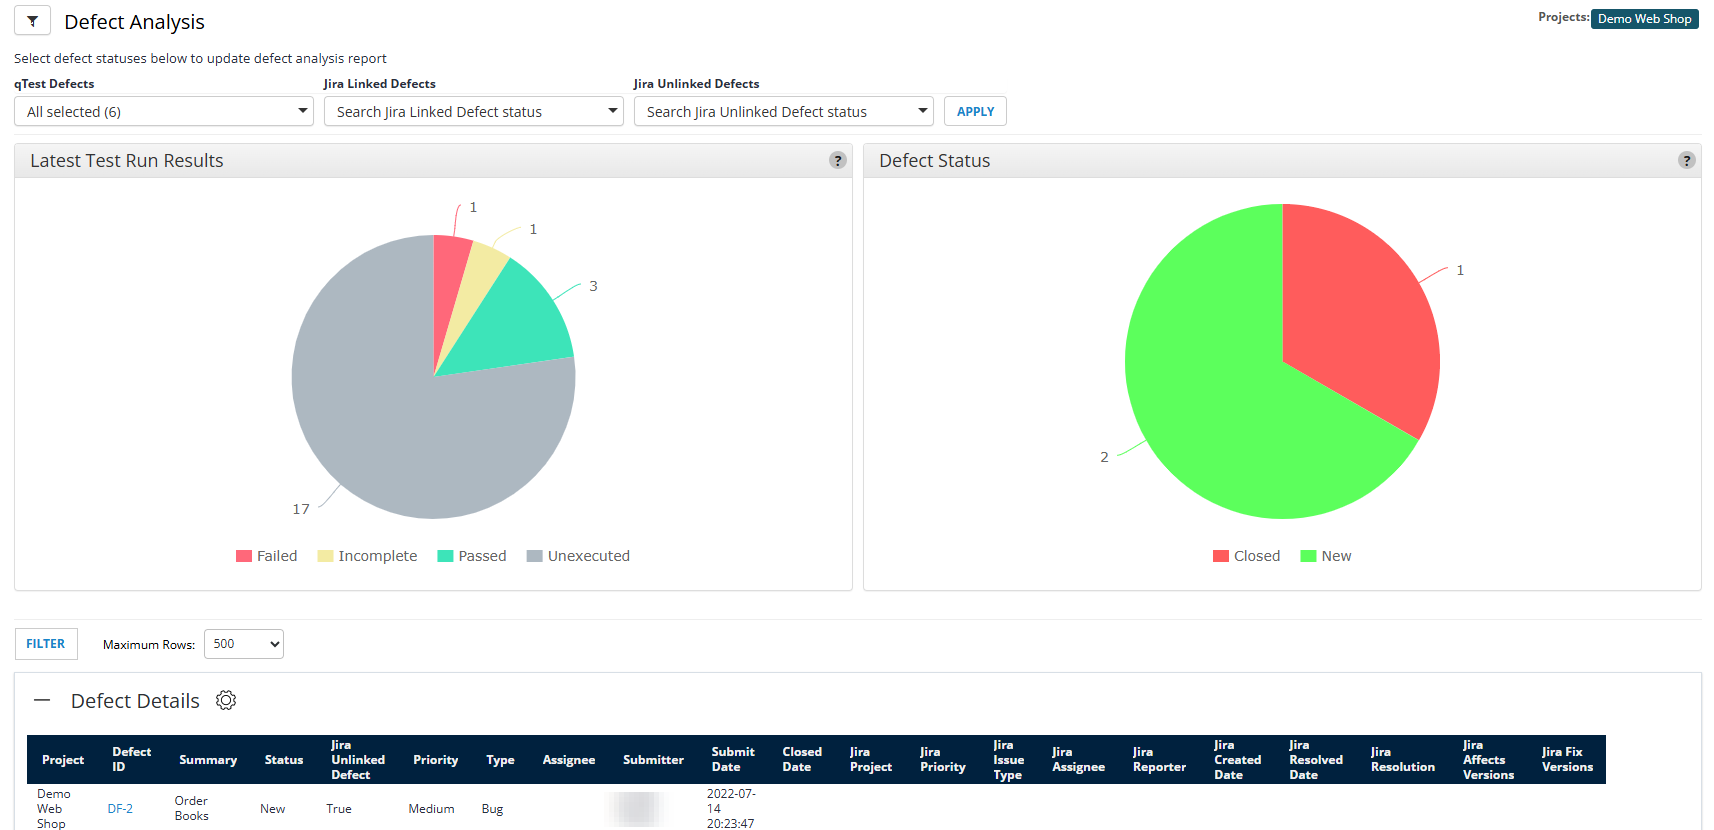
Use the Defect Analysis report to filter and view defects in your project.
The Defect Analysis report includes three charts:
-
Latest Test Run Results: Pie chart displaying the latest Test Run results by status.
-
Defect Status: Pie chart displaying the number of defects of each status (including Jira defects linked and unlinked).
-
Defect Details: Table data for all the defects created in Jira or Manager. The data is ordered by ID and excludes these statuses: Closed, Deferred, Withdrawn and Rejected.
To view data in the Defect Status and Defect Details charts, choose the defect status values that you want to view data for in the qTest Defects, Jira Linked Defects, and Jira Unlinked Defects dropdowns, then select Apply.
Portfolio Overview
You can use the Portfolio Overview report to look at your cross-project statistics and directly compare portfolio values.
The exact statistics you track depend on your needs, since you're going to have custom portfolio values. For example, you could use the portfolio tools to track testing for different coding languages across your projects. In this case, the portfolio can compare all languages, with each portfolio value tracking a different coding language.
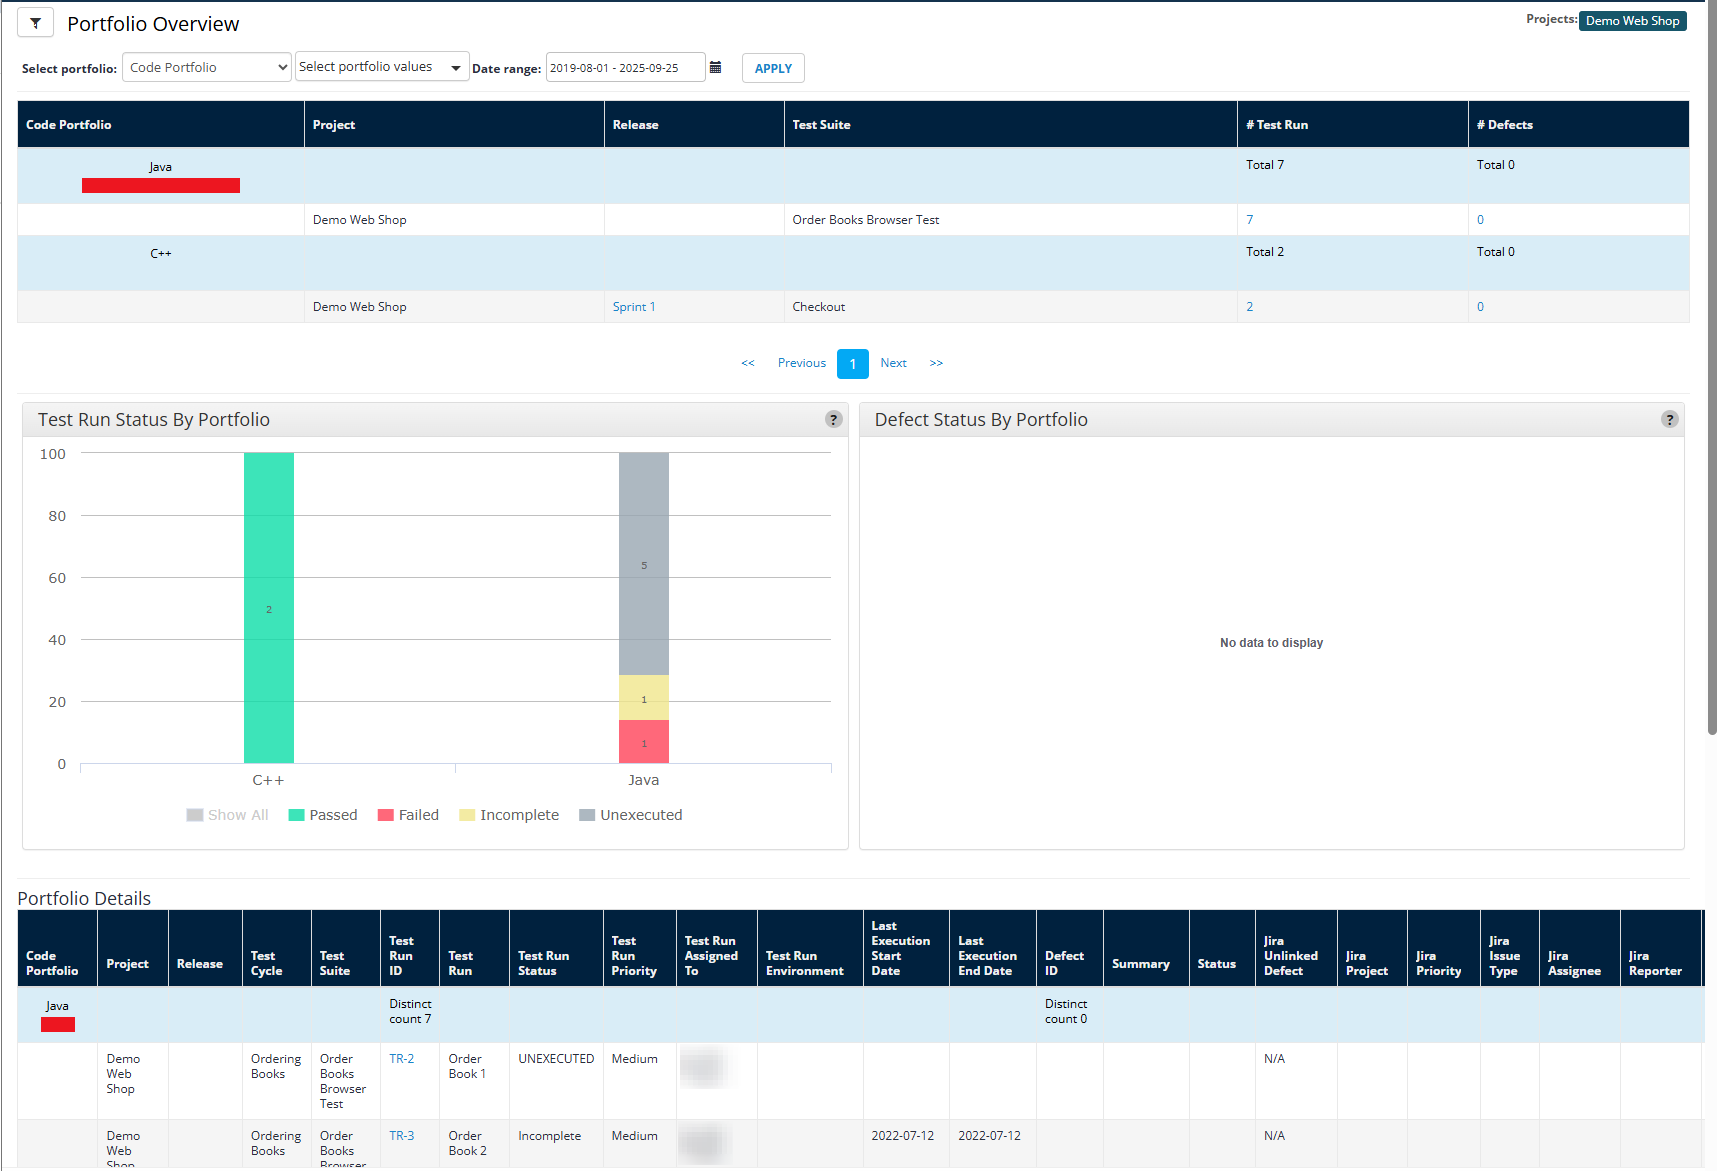
The Portfolio Overview report lets you track custom statistics across projects and portfolio values.
The Portfolio Overview includes the following charts:
-
Test Run Status by Portfolio: Bar graph that displays the status and number of test runs in each portfolio.
-
Defect Status by Portfolio: Graph that displays Jira defect status for items in your portfolio. Please note that this does not include qTest defects, only linked Jira defects.
-
Portfolio details: A table that includes details for test runs, linked and unlinked Jira defects, and where your Jira Defect Custom fields get applied. Additionally, if you set up conditional status formatting, it will display in these cells.
After you set up a portfolio, follow the steps below to view it in the Portfolio Overview:
-
Select the portfolio you want to view from the Select Portfolio dropdown.
-
Choose which custom values you want to view from the Select portfolio values dropdown.
-
You can also set a Date range for the data you want to view.
-
Select Apply to view your data.
Portfolio Progress
You can use the Portfolio Progress report to dig deeper into an individual portfolio value.
For example, if you track your coding languages using the portfolio tools and notice an issue with the Java portfolio value, you can use the Portfolio Progress report to view deeper trends in your Java testing.
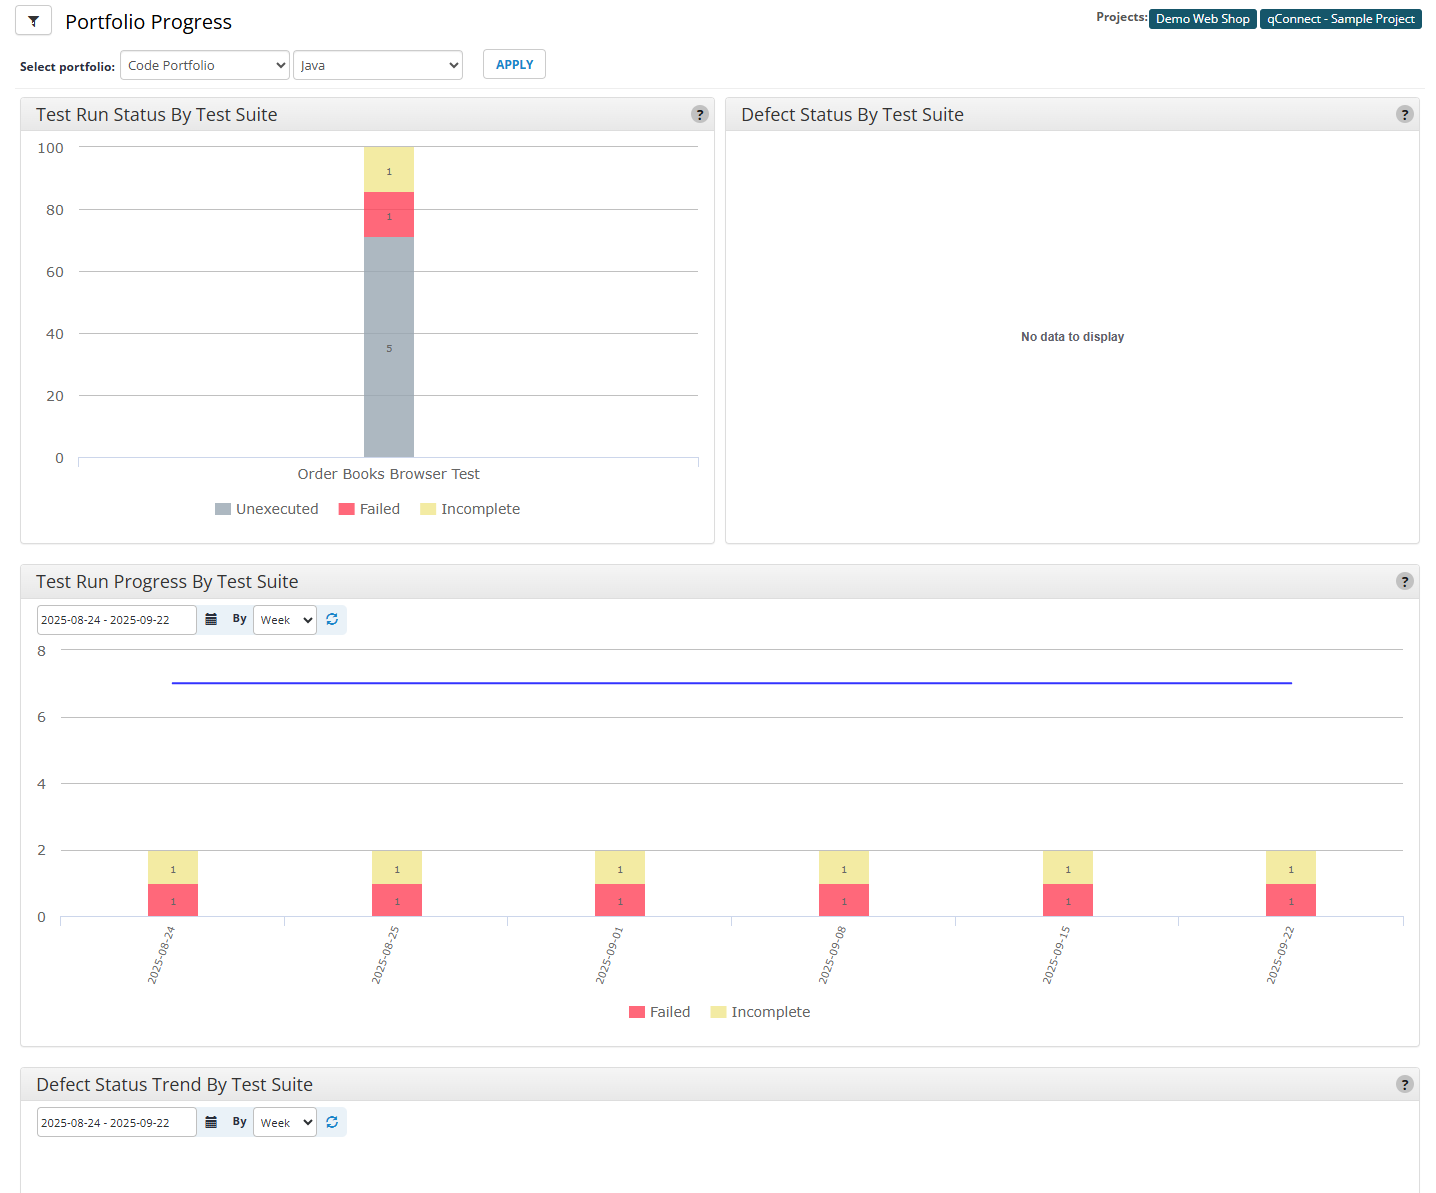
Use the Portfolio Progress report to dive deeper into test run and integrated defect data for your custom portfolio values.
The Portfolio Progress report includes the following charts:
-
Test Run Status by Test Suite: Bar graph that displays the status and number of test runs in each test suite tagged with your selected portfolio value.
-
Defect Status by Test Suite: Graph that displays Jira defect status for each test suite tagged with your selected portfolio value. Please note that this does not include qTest defects, only linked Jira defects.
-
Test Run Progress by Test Suite: Bar and line graph that displays the status and number of test runs over time in each test suite tagged with your selected portfolio value.
-
Defect Status by Test Suite: Graph that displays Jira defect status trends over time for each test suite tagged with your selected portfolio value. Please note that this does not include qTest defects, only linked Jira defects.
Follow these steps to use the Portfolio Progress report:
-
Select the portfolio you want to view from the Select Portfolio dropdown.
-
Go to the next dropdown and select the portfolio value you want to view. These are the site fields you set up for the portfolio you selected.
-
Apply your changes and the Portfolio Progress charts will populate with data based on your configurations.
Tests Planned vs. Executed
You can use the Tests Planned vs. Executed report to view your actual testing progress against your expected testing progress. Before you can do this, first you need to set up the baselines and values you want to track in Settings.

Use the Tests Planned vs. Executed report to view your actual testing progress against your estimated testing capacity.
The Tests Planned vs. Executed report displays the following information:
-
Tests Planned vs Executed: A line graph that displays the relationship between planned executions defined during report setup and passed executions.
-
Tests Planned vs Executed Details: A table that includes more detail about the associated planned and executed tests.
The color blocks next to the Execution and Passed columns in the Tests Planned vs. Executed Details table show how close you are to reaching your expected test count. Here's what each color indicates:
-
Green means the actual number of tests executed or passed is greater than or equal to 90% of the expected number.
-
Yellow means the actual number of tests executed or passed is greater than or equal to 80% but less than 90% of the expected number.
-
Red means the actual number of tests executed or passed is less than 80% of the expected number.
Please note that you can't edit thresholds or associated colors for the Tests Planned vs. Executed report at this time.
After you set up your report, go to the Tests Planned vs. Executed report and select the configured report you want to view from the Select Report dropdown.
Filter a report
Users with Insights Editor permissions can apply and save filters on most prebuilt reports to create more specific views. For example, you can create multiple versions of the same report to cover different projects.
Please note that you can't apply global filters to the Tests Planned vs. Executed report, since you've already defined this report's projects and artifacts.
To create a filter, follow these steps:
-
Select the
 Global Filter icon to open the Filters panel.
 -
Narrow down your report using the following values: Projects, Test Cycles, Modules, and Release. Any changes to your criteria affect the full dashboard view.
-
If you're filtering a portfolio report, you can set the filter to automatically refresh at intervals of 1, 2, 5, 10, or 20 minutes. You can also select Refresh Now at any point to reload your dashboard with the latest data.
-
Select Save as and give your filtered report a name.
Your browser keeps track of your Global Filter settings with cookies. To make sure these cookies don't affect other report views, be sure to remove the global filters before you navigate away from a report saved with filters.
To access your filtered dashboards, navigate to Manage Reports in the Reports dropdown. Unless you choose to share the filtered report with other editors, only you can see the filtered version.
What's next
Saved a filtered report that you want to work with? Take a look at how to manage saved reports.