Dashboards
To help you work with your test data and visualize how statistics evolve over the test duration, NeoLoad Web provides tools to dynamically analyze your tests:
-
Graphs: These are automatically built from predefined data. You can locate them in the Overview tab of the Test Result view. Graphs help highlight trends. For more information, see Running test graph.
-
Pre-configured reports: These reports are generated automatically from the Test Results. For more information, see Pre-configured reports.
-
Widgets: There are several available in the Dashboards view that allow you to build customized reports.
Manage Dashboards
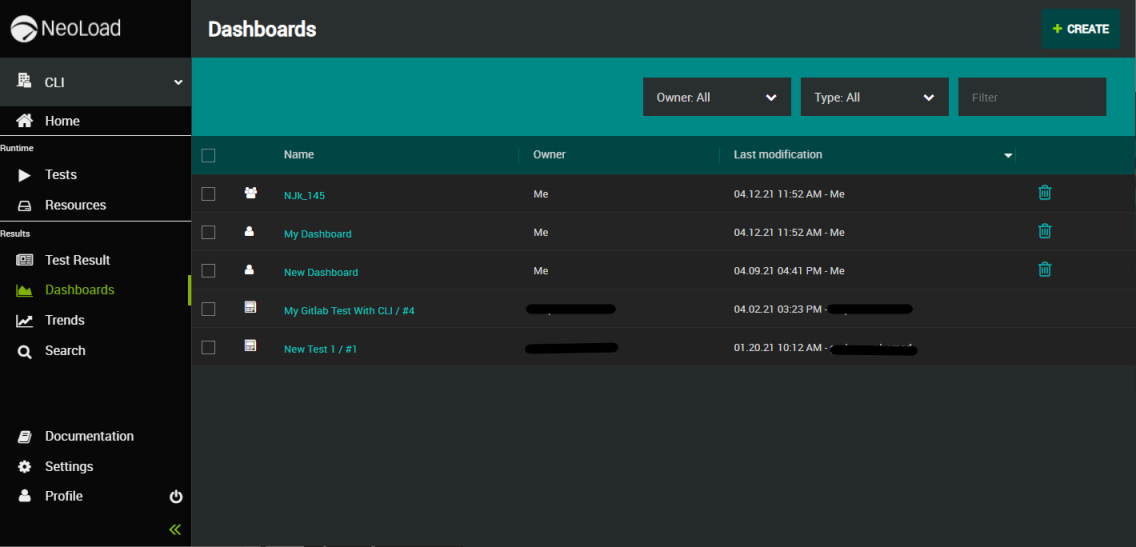
The Dashboards view is designed to help you create, manage, display and analyze as many graphs and boards as required for selected Test Results. Each Dashboard can contain one or several panels where you can trace curves and tables from your test metrics and write text as comments.
Dashboards available in the Workspace(s) you are a member of appear are listed in the Dashboards view.
Description of the columns
Checkbox:Tick the check boxes of the Dashboard(s) to do a bulk delete.
Icons: Dashboards are tagged with the following icons:
-
the
 icon indicates that the Dashboard is a pre-configured report
 -
the
 icon means that the Dashboard is shared
 -
the
 indicates that the Dashboard is not shared
Name: This is the name of the Dashboard.
Owner: This is the name of the user who created the Dashboard and in the case of a pre-configured report, the user who ran the test.
Last modification: This is the date, time and author of the last modification made to the Dashboard. This enables any member of a Workspace to see when and by whom a change was made to a shared Dashboard.
What's next
Learn more about pre-configured reports.
Learn more about customized reports.