Trace a graph
A graph can contain various types of curves, coming from different Test Results executed in the project.
You can for example compare a running test with a test already completed by you or a collaborator by tracing the 2 relevant graphs.
Values can be plotted in real time during the test or after a test is finished. When a live statistic is graphed, the curve is updated as soon as a new point is available.
Follow the steps below below if you want to create a new graph or add a curve to an existing graph.
Note: You can add as many curves as you want. It is possible to hide them for better visibility.
To trace a graph, follow these steps:
-
Select a Workspace as described in Workspace selector.
-
You can either:
-
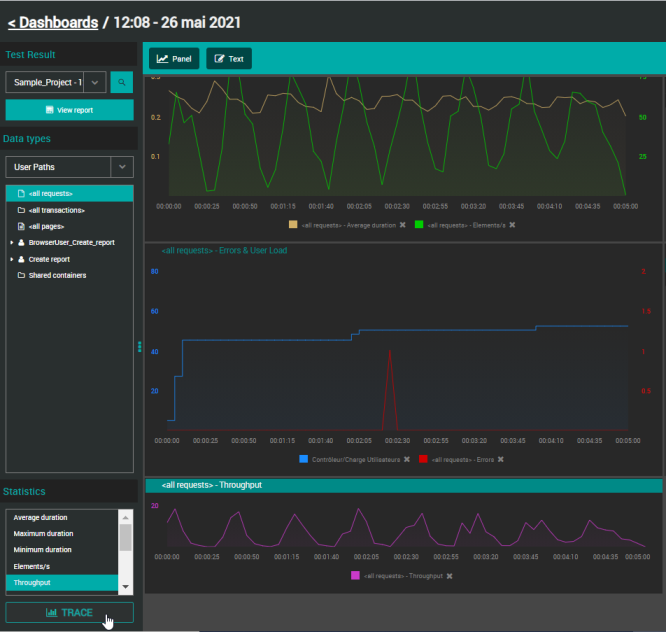
Start from the Home or Search view and open a Test Result and once in the Test Result view, click the View report link. In this case, go directly to step 3.
-
Start from the Dashboards
 view.
view.
-
-
In the Dashboards view, select Dashboard and a Test Result.
You can either:-
Select a Test Result from the Test Result drop-down list.
-
The Test Result drop-down list contains all Test Results (running and finished) started on the Account.
-
Running tests are identified with a spinning icon.
-
-
Search with the
 icon which opens the Search panel: Apply your search criteria and click the desired Test Result to have it selected in the Dashboard.
-
-
Whether you want to plot a new graph or add a curve to an existing graph:
-
If you want to trace a new graph, click the Panel button.
-
Select an existing graph where you want to add a curve.
-
-
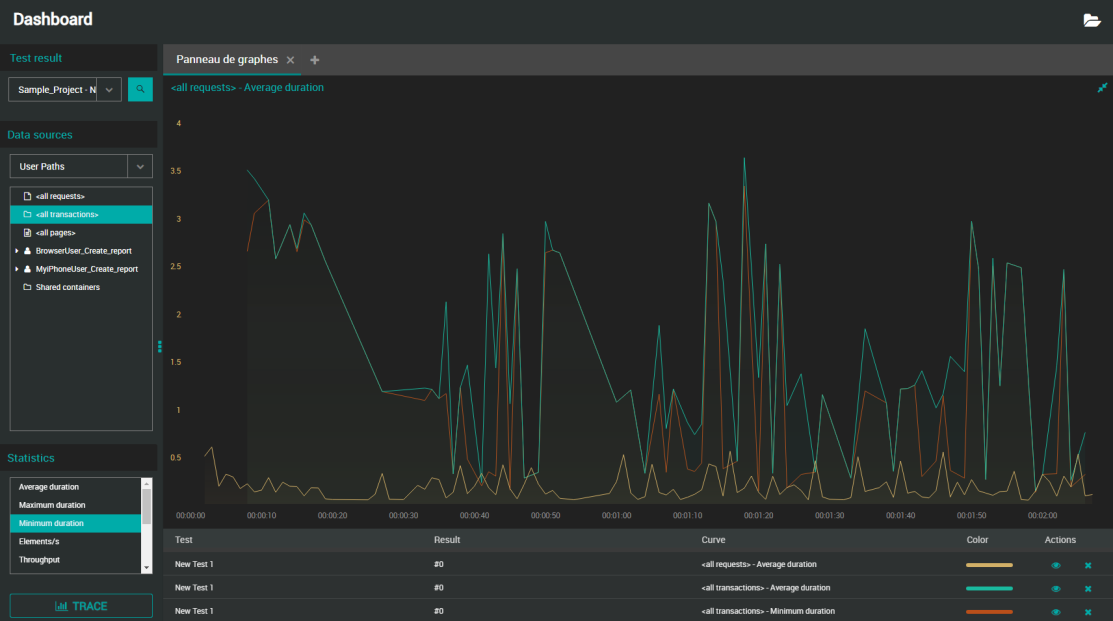
In the Data types tree, select the source from where you want to trace values: User Paths, Monitors or Preset analysis.
-
For Users Paths only, in the Statistics panel, select the statistic you want to plot.
-
Click the TRACE button.
The graph is plotted accordingly with a curve representing the element and its statistic.
Unless you are using a mobile phone, you can directly make a drag and drop instead of clicking the TRACE button:
-
User Paths: Drag the statistic you want to trace and drop it on the graph of your choice (doesn't have to be the active one).
-
Monitors: If you drag and drop a parent element on a graph, all of its children will be plotted as separate curves.
Note: When created, the default name of the graph is "<Name of the element> - <Name of the statistic>". To change it, see Rename a graph.
Read a graph
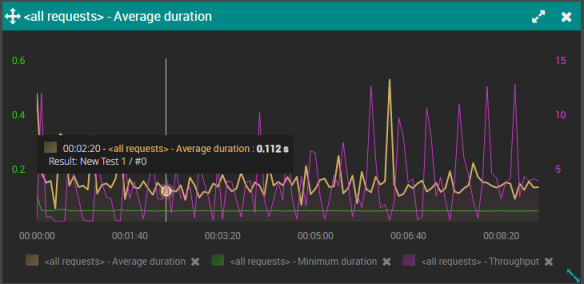
You can trace a graph with several types of statistics and monitors curves, coming from different Test Results executed in a project. It is possible to maximize a graph so you can see more information at once, namely the legends below it. Otherwise, please find below how to read a small graph.
When you place the mouse cursor over a curve, the following information is displayed:
<Time of the point on the X-axis> - <Element traced by the curve with its font color>: <value and unit in bold>
<Result: test name / test result name>
When maximizing the graph, the Test column allows identifying the test setting the curve is related to.