Edit and delete curves
This topic explains how to change the color of a curve, hide or unhide it, and how to delete curves from your graphs.
Change the color of a curve
When several curves are displayed in a graph, it may be useful to change the color of each of them to spot them more quickly.
A curve color can only be changed after maximizing the graph it is displayed in. For more information, see Maximize/minimize a graph.
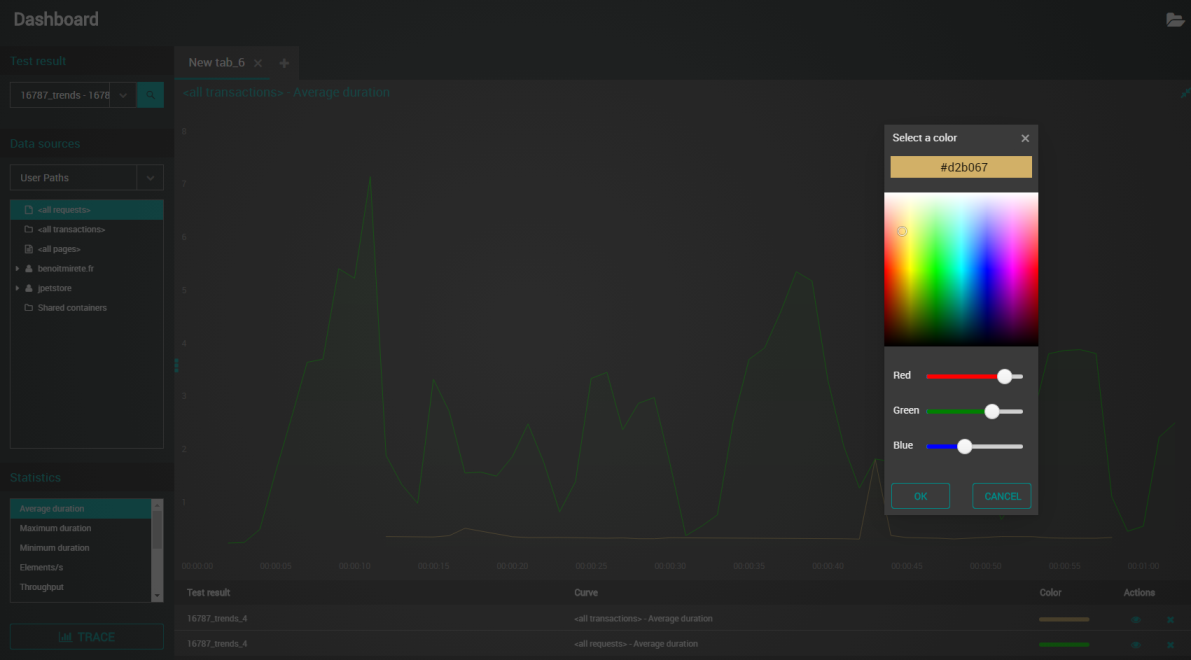
The color picker is accessible with a click on a curve color under the Color column on the bottom right of the graph.
To change the color of a curve, follow these steps:
-
Select a Workspace as described in Workspace selector.
-
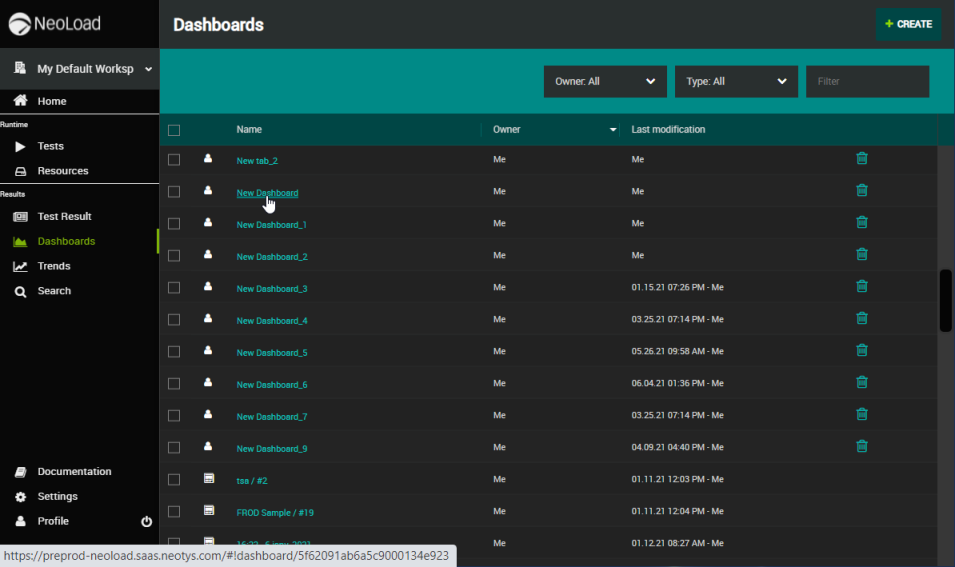
In the left navigation panel, select the Dashboards view.
The table lists the Dashboards in your Workspace.
-
Locate the Dashboard containing the graph that you want to modify and select it by clicking on its name in green.
The view changes to display the selected Dashboard.
-
Maximize the graph containing the curve(s) to be modified. For more information, see Maximize/minimize a graph.
-
On the bottom right of the graph, click the curve color you want to modify.
-
In the color picker, select the color of your choice in the color palette or by adjusting the cursors. You can also enter the color code.
-
Click OK.
Hide/unhide a curve
To free a panel, you can remove temporarily one or several curves from a graph.
Follow the steps below to temporarily remove a curve. If you want to delete it definitely, see Delete a curve.
To hide/unhide a curve, follow these steps:
-
Select a Workspace as described in Workspace selector.
-
In the left navigation panel, select the Dashboards view.
The table lists the Dashboards in your Workspace.
-
Locate the Dashboard containing the panel that you want to modify and select it by clicking on its name in green.
The view changes to display the selected Dashboard.
-
In the bottom of the panel, click the curve legend you want to hide.
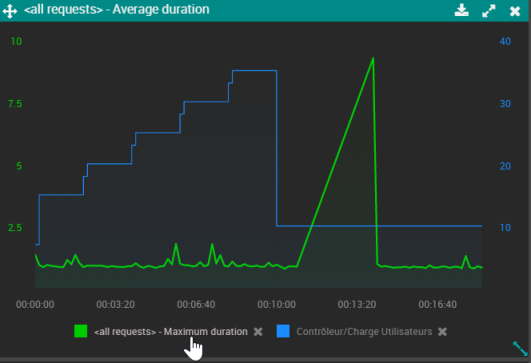
The curve is hidden from the graph and its legend is greyed out.
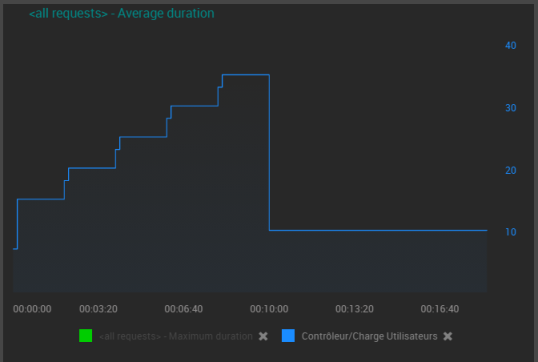
Note: Click the greyed-out legend to make the curve visible again.
Delete a curve
To free a panel, you can delete one or several curves from a graph.
Follow the steps below to definitively delete a curve. If you want to remove it temporarily, see Hide/unhide a curve.
To delete a curve, follow these steps:
-
Select a Workspace as described in Workspace selector.
-
In the left navigation panel, select the Dashboards view.
The table lists the Dashboards in your Workspace.
-
Locate the Dashboard containing the panel that you want to modify and select it by clicking on its name in green.
The view changes to display the selected Dashboard.
-
In the bottom of the panel, click the X button next to the curve legend you want to delete.
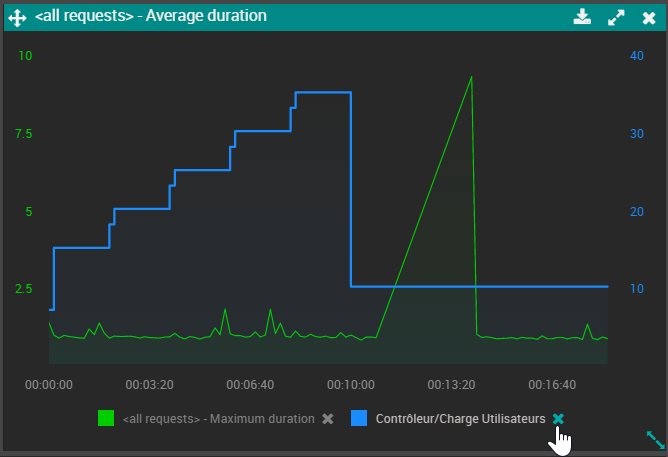
-
Click DELETE in the confirmation pop-up.
The curve is deleted from the graph.