Trends
The Trends view makes it possible to view and analyze the results of a selected number of tests. After configuring the results to display, the Trends view allows you to analyze the Test Results sharing the same project and scenario.
The Trends view is accessible with a click on Trends in the navigation panel.
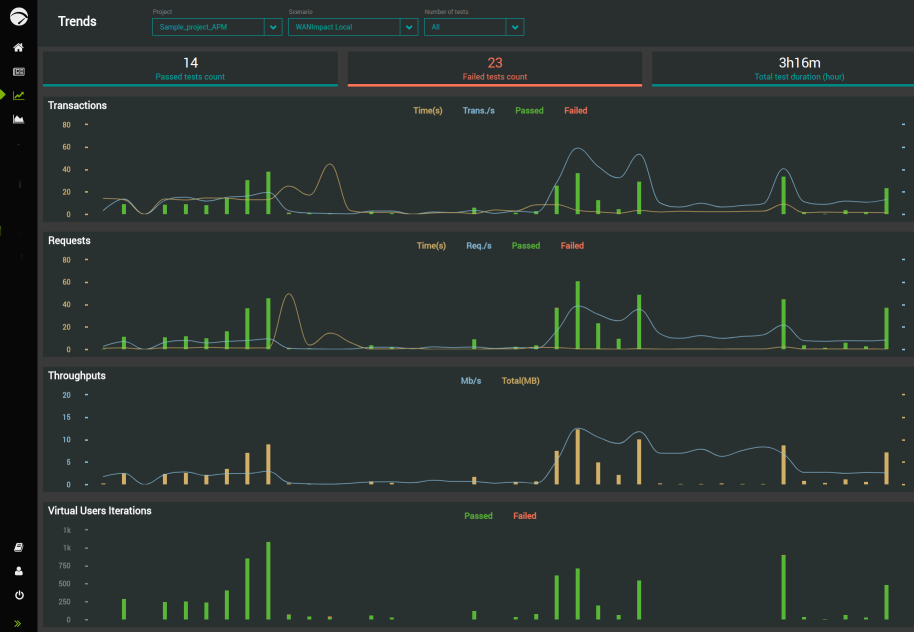
The Trends view makes it easier to analyze a given number of Test Results by regrouping all the necessary metrics in the same page.
Note: The Trends view only displays finished Test Results. You cannot analyze running test trends.
The Trends view regroups four major metric groups that are:
-
Transactions
-
Requests
-
Throughputs
-
Virtual Users Iterations
Each metric group is displayed in a dedicated zone.
Configure the Trends view
The Test Results to be displayed in the Trends view can be configured via the Project, Scenario and Number of tests list boxes on top of the screen.
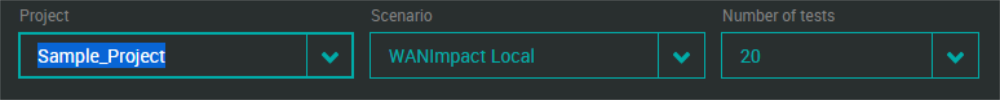
Project: The list box displays the projects available for analysis in the Trends view. The projects displayed are imported from NeoLoad as they must be created and configured beforehand. For more information about connecting NeoLoad to NeoLoad Web, see NeoLoad Web.
Scenario: The list of scenarios associated with the selected project are listed here.
Number of tests: This list makes it possible to choose the number of tests to display for the selected project. The number stands for the most recent tests.