Analyze Virtual Users iterations metrics
The Virtual Users iterations section in the Trends view displays the trends for the Virtual Users iterations carried out during the project execution.
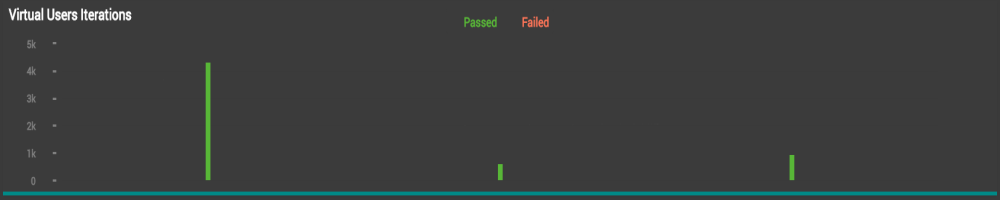
For each test, the Virtual Users iterations are illustrated as follows:
-
A green bar shows the total number of Virtual Users iterations successfully carried out during the test.
-
A red bar shows the Virtual Users iterations that failed during the test.
As you move the mouse pointer over a bar, the Transactions, Requests, Throughputs and Virtual Users Iterations metrics for the selected Test Result are displayed in the corresponding sections. Below is an illustration for Virtual Users Iterations metrics.

The test name and status and the date when the test was launched are displayed below the metrics.
A click on a Virtual Users iterations representation metrics representation redirects you to the Test Result view. The Test Result view gives you valuable and accurate information about the selected Test Result. The Indicators zone in the Test Result view are those used in the Trends view.
For more information about the Test Result view, see Test Result view and Test Results.

-
Passed: A click on the Passed item displays/hides all the Virtual Users iterations successfully carried out during a test.
-
Failed: A click on the Failed item displays/hides all the Virtual Users iterations that encountered an error during a test.