Capture the execution of your tests
If you want to capture and document the execution of your tests for reporting purposes, you can configure Tosca to perform the following actions:
-
Take screenshots of failed TestSteps:
Tosca generates screenshots of all TestSteps that failed because of verification or dialog failures.
-
Take screenshots of TestStepValues:
Tosca generates screenshots of all TestStepValues that use the ActionMode Input. Use this option if you want to view screenshots of values that Tosca used during execution.
-
Use DokuSnapper to generate a PDF, Microsoft Word or Excel document that contains screenshots and data on all executed TestSteps. Rather than generate separate screenshots for every TestStep, DokuSnapper collects all data in one document for each TestCase.
If you run TestCases via ExecutionList, DokuSnapper creates a document for each completed ExecutionEntry. If you run TestCases in the ScratchBook, DokuSnapper creates a single document.
-
Use the execution recorder to record a test execution video that shows how Tosca navigates the tests you designed. This allows you to review your tests in action and uncover areas that may need some improvement.
Take screenshots of failed TestSteps
With this option, Tosca takes screenshots of all TestSteps that fail because of a verification or dialog failure. This helps you identify issues with your user interface or with your interface tests when you debug them during trial runs.
Enable this option
To enable screenshots of failed TestSteps, configure the setting Make screenshot on failed test steps at Settings->TBox->Logging->Screenshots.
You can also configure related settings, for example to change the image format.
View screenshots
You can see your screenshots in the Screenshot column of your test results.
If you use Tricentis File Service, check the Detail column instead. It displays a message that Tosca has saved the screenshot. To view it, right-click the ExecutionEntry and select View Screenshots from the context menu.
Take screenshots of TestStepValues
With this option, Tosca takes screenshots of all TestStepValues that use ActionMode Input. This helps you identify issues with the user interface at input steps or with incorrect values in your tests.
Enable this option
To enable screenshots of TestStepValues that use ActionMode Input, configure the settings Screen Flow and Screen Flow Path at Project->Settings->TBox->DokuSnapper.
View screenshots
You can see the path to your screenshots in the Detail column.
If you use Tricentis File Service, the Detail column displays a message that Tosca has saved the screenshot. To view it, right-click the ExecutionEntry and select View Screenshots from the context menu.
Use DokuSnapper to generate test execution reports
DokuSnapper allows you to generate detailed documents containing relevant execution details for each of your TestCases. Here are the key aspects of documenting test execution with DokuSnapper:
-
Each report includes detailed data for all executed TestSteps, providing a clear and thorough overview of the test execution.
-
If the application under test has a graphical user interface (GUI), the report also includes screenshots of your application at the time of the test.
-
You can choose between PDF, Microsoft Word, or Microsoft Excel formats for your reports, depending on your needs and preferences.
-
You can use your own templates to tailor the report content, ensuring it meets your specific requirements. Templates work for PDF and Microsoft Word, but not Microsoft Excel.
Get started with DokuSnapper
To enable DokuSnapper, change the setting Enable Snapper in Settings->TBox->DokuSnapper. Once that's done, Tosca automatically starts saving DokuSnapper reports in the directory specified in the Path setting.
Note that for large sets of TestCases, DokuSnapper may consume significant processing power and memory. If you have performance concerns, consider excluding Modules or ModuleAttributes from recording.
Work with templates
You can customize your PDF or Microsoft Word DokuSnapper report by modifying its existing template. This way, you can tailor your reports to your exact needs. To do so, you can use specific placeholders that Tosca replaces with actual test information at runtime.
You can find example templates at C:\Program Files\Tricentis\Tosca Testsuite\TBox\Resources.
Templates include a cover and overview as the first pages, where you can exclusively use placeholders related to your TestCase:
|
Placeholder |
Equivalent information |
|---|---|
|
<Duration> |
The length of your TestCase run. |
|
<ErrorTestSteps> |
The number of TestSteps that encountered an error. |
|
<FailedTestSteps> |
The number of failed TestSteps. |
|
<NoResultsTestSteps> |
The number of TestSteps without results. |
|
<PassedTestSteps> |
The number of successful TestSteps. |
|
<TestCaseName> |
The name of your TestCase. |
|
<TestCaseResult> |
The result of your TestCase: passed or failed, for instance. |
|
<TestCaseStartTime> |
The exact time your TestCase started execution. Displays date time according to Tosca Date format and Tosca Time format under Settings->TBox->Dynamic Temporal Expressions. |
|
<TestCaseEndTime> |
The exact time your TestCase finished execution. Displays date time according to Tosca Date format and Tosca Time format under Settings->TBox->Dynamic Temporal Expressions. |
|
<[ToscaObjectProperty]> |
The value of any property of your TestCase. Replace [ToscaObjectProperty] with the property you want to report on. For instance <TestCaseWorkState>, if you want to report on the actual WorkState of your TestCase. Note that to use this placeholder, you must set Settings->TBox->DokuSnapper->Make all properties available to Yes. |
After the cover and overview, you'll see a page with placeholders in the upper-left corner. It's a table with two columns but the borders and gridlines are invisible.
The right side of the table is exclusively for the screenshots that Tosca captures during the test runs of applications with a GUI. Adjust the column width if you need larger screenshots. You can't add any placeholders in this column.
You can, however, use the following placeholders on the left side of the table:
|
Placeholder |
Equivalent information |
|---|---|
|
<Log> |
A predefined set of basic test information and values used. Try this option if you don't want to be too granular about which details go into your report. |
|
<TestStepName> |
The name of the TestStep that was executed. |
|
<TestStepResult> |
The result of the TestStep that was executed. |
|
<TestStepStartTime> |
The exact time when your TestStep started execution. Displays date time according to Tosca Date format and Tosca Time format under Settings->TBox->Dynamic Temporal Expressions. |
|
<TestStepEndTime> |
The exact time when your TestStep finished execution. Displays date time according to Tosca Date format and Tosca Time format under Settings->TBox->Dynamic Temporal Expressions. |
|
<UsedValue> |
The actual value used in your TestStep used during its execution. |
You mustn't add columns to the table or add tables to the templates.
View buffers as tables
By default, Buffer operations, such as TBox Set Buffer, appear as descriptions of the TestStep. Instead you can have the Buffer Name, Value, Action, and Log info displayed in a table.
To do so, add the test configuration parameter DokuSnapperShowBuffersInTable and set the value to True.
Exclude Modules or ModuleAttributes
You can exclude individual Modules or ModuleAttributes from recording with DokuSnapper.
To exclude Engine 3.0 XModules or XModuleAttributes, create a configuration parameter called AvoidSnapper and set it to True.
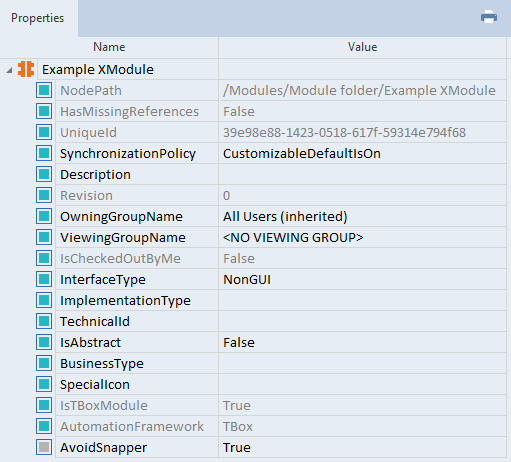
Exclude Example XModule from recording with DokuSnapper
Access your DokuSnapper document
Once you've run your tests, you can access your DokuSnapper document. Where you find it depends on what you selected in the Storage Location Type setting:
-
If the setting's value is Local, your document is in the folder you entered into the DokuSnapper Path setting.
-
If the setting's value is Tosca, right-click your execution log and select Search all->References from the mini toolbar. In the search results, right-click AttachedExecutionLogFile and pick your preferred option from the context menu: open the document or save a copy.