Use Report Designer
Report Designer lets you create customized reports, so you can keep your team updated on the latest state of your tests. For quick and easy reporting, you can adapt the reporting templates that Tosca offers as part of the Standard subset. You can also build your own.
Please note that Report Designer is based on a third-party software, List & Label®. For detailed instructions on how to customize reports in the Report Designer user interface, check out the List & Label manual (opens in new tab).
Before you start
Before you can use Report Designer, make sure you have these things in place:
-
You've created a Report Definition.
-
You've specified a Dataset Definition.
-
You've selected Default as your Designer Definition.
Add custom design objects to your report
There's a variety of default List & Label objects you can use to customize a report, such as text, variables, charts, or tables.
You can also add custom Tosca Commander design objects, which are attributes to fine-tune your report. Check out the list of available objects and their attributes at the end of this topic.
To add custom design objects to your report, follow these steps:
-
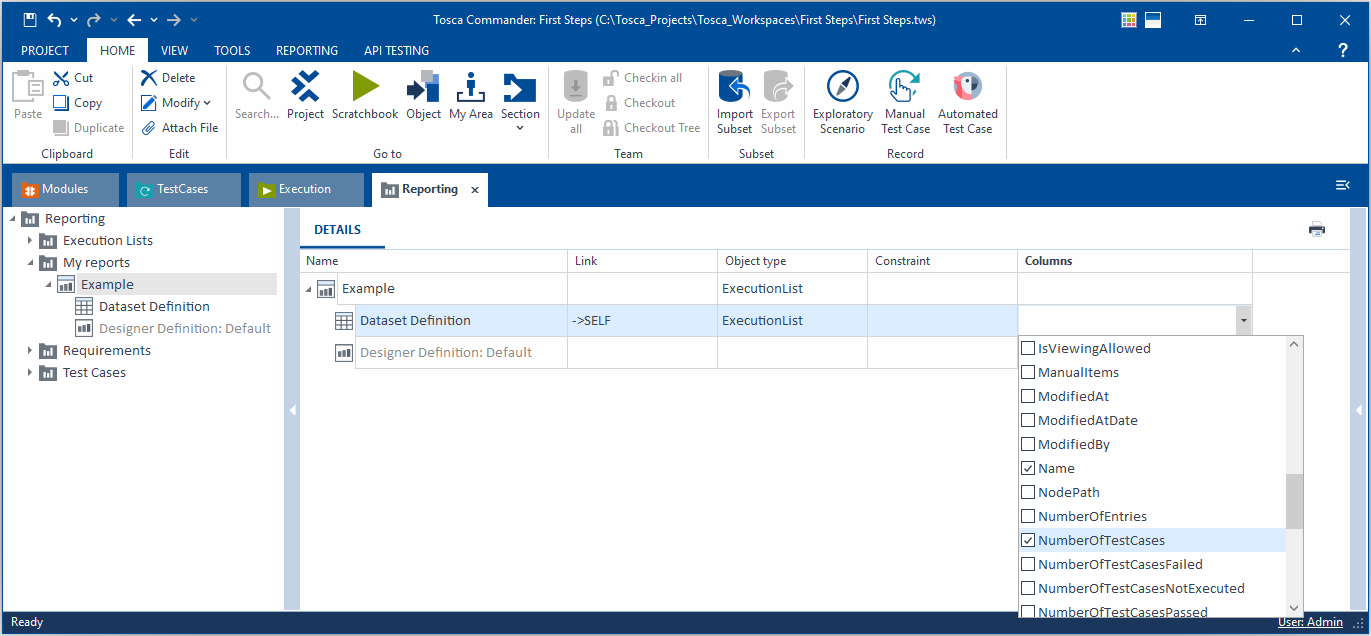
Go to the Reporting section and select your report.
-
In the Details tab, check whether you see the Columns column. If you don't see it, use the Column Chooser to add it.
-
For the Dataset Definition, choose the following from the Columns dropdown:
-
The attribute Name.
-
All other attributes you want in your report. The Object type determines which attributes are available.
We recommend that you only add attributes that are strictly necessary for your report. Each additional attribute increases the amount of data that Tosca has to load, which increases wait times.
-
Add custom objects to the Example report
Design your report
To design your report, follow these steps:
-
Right-click the Report Definition and select Design Report... from the context menu.
-
In the Report Designer interface, create your report layout. For detailed instructions, check out the List & Label manual (opens in new tab).
Additional steps for custom design objects
If you've added any custom design objects, you need to perform a few extra steps to display the information correctly:
-
In the Objects tab of Report Designer, double-click the container element that includes custom design objects.
-
In the subsequent dialog, go to the Data Line tab and select
 Append line definition->Text.
 -
In the next dialog, go to the Data and Functions tab and perform the following actions:
-
Expand the Fields list and find your container element. Then, expand the container element.
-
In the container element list, double-click SurrogateNum and select OK.
-
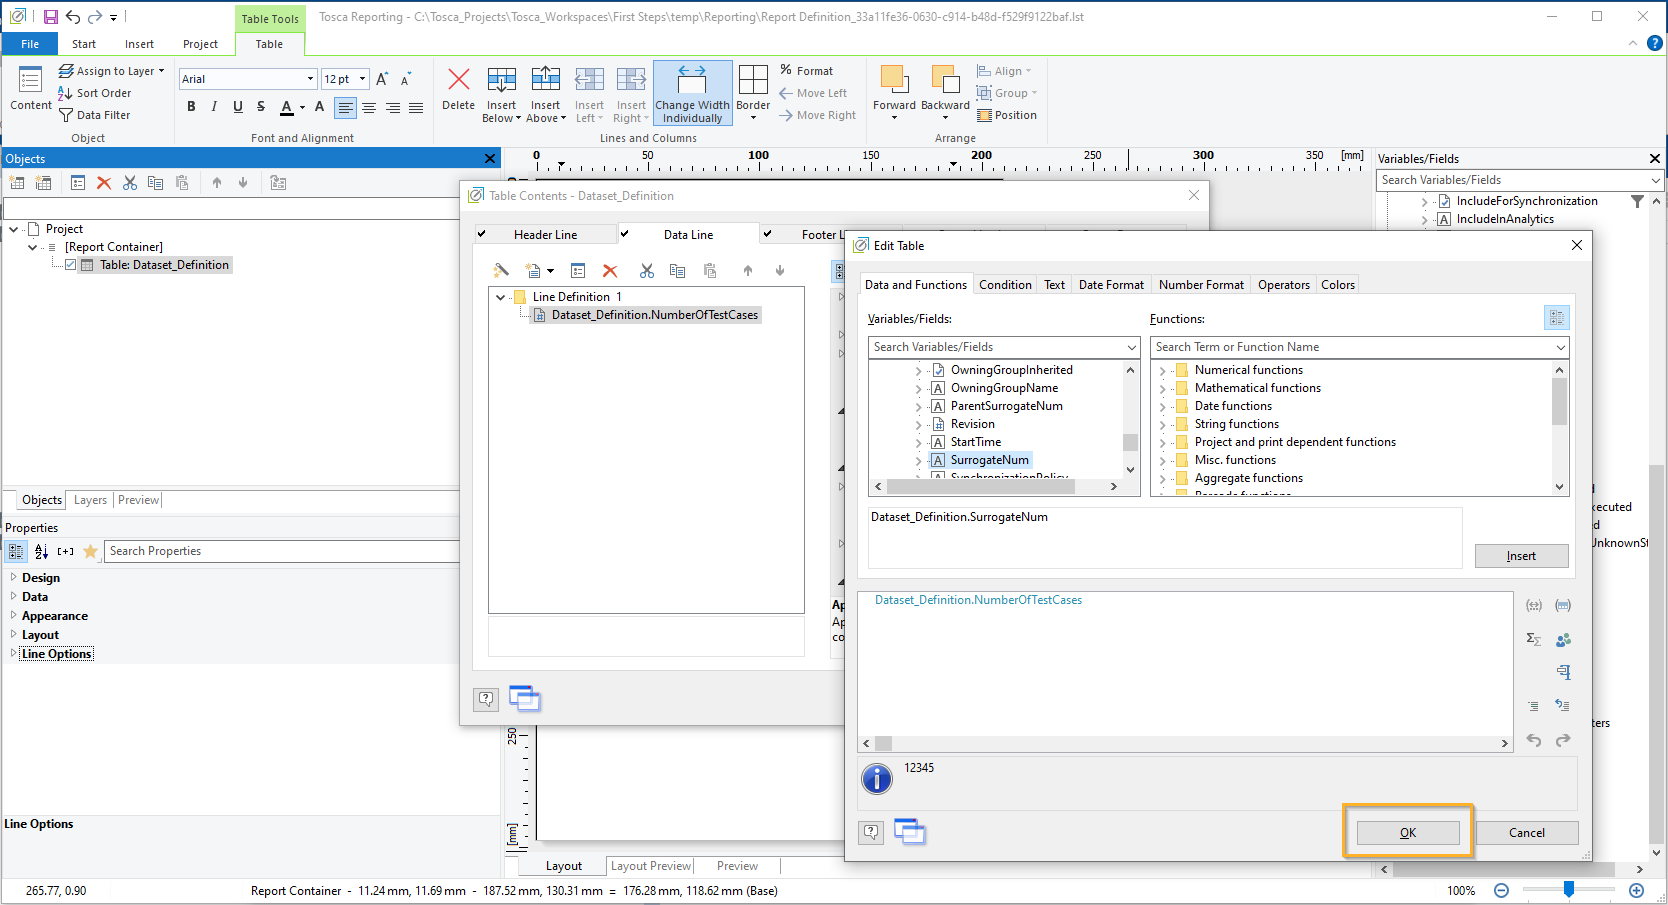
Add SurrogateNum to the attribute NumberOfTestCases
-
You're now back in the Table Contents dialog. From here, select SurrogateNum, then go to the Layout section and set Appearance Condition to Never Show.
Upgrade reports
If you created reports with List & Label versions that Tosca doesn't support anymore, you need to upgrade these reports before you can continue to edit or print them. Note that you can't revert upgraded reports.
To upgrade a report, follow these steps:
-
Go to the report definition you want to upgrade.
-
Right-click the Report Definition element underneath and select Upgrade Report to use latest ListAndLabel version from the context menu.
-
If you've upgraded from 2023.2 or older and you use custom design objects in your report, you also need to perform these additional steps for custom design objects.
Tosca Commander custom design objects and attributes
You add the following custom design objects to a report:
The ExecutionLog chart displays the execution results as in the Tosca Commander Loginfo column (see chapter "Work with execution results").
In order to correctly display these results, select the following attributes for the object type ExecutionLog:
-
NumberOfTestCases
-
NumberOfTestCasesPassed
-
NumberOfTestCasesFailed
-
NumberOfTestCasesNotExecuted
-
NumberOfTestCasesWithUnknownState
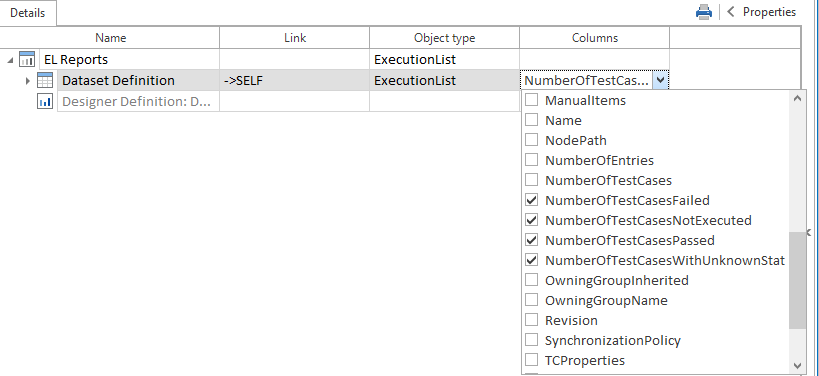
ExecutionList attributes for ExecutionLog Chart
The chart is displayed in the report as shown below:
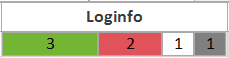
ExecutionLog chart
You can transfer the Passed and Failed icons from an ExecutionList to Report Designer.
In order to do this, select the Resultattribute for the Object type ExecutionTestCaseLog.
![]()
ExecutionTestCaseLog attribute for Execution Result Icon
The Passed and Failed icons are displayed in the report as shown below:

Execution result
Requirement Execution Status Chart
For RequirementSets and Requirements, you can display the cells from the Execution State (%) column in your report. To correctly display this chart, select the following attributes for the object types RequirementSets and Requirements:
-
StatusPassed
-
StatusFailed
-
StatusMissingLink
-
StatusNotExecuted
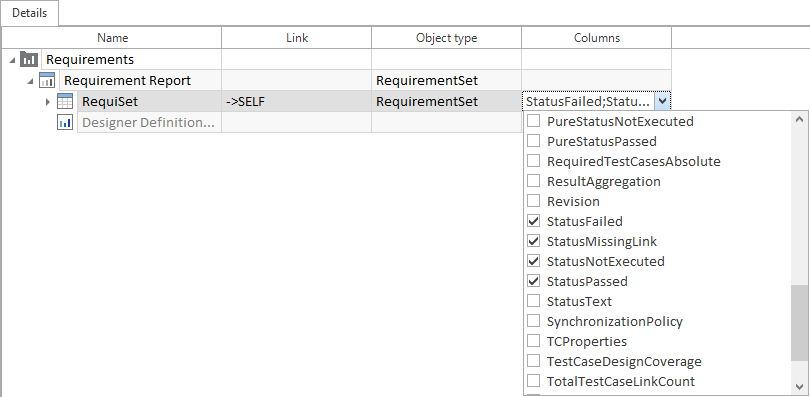
RequirementSet attributes for Requirement Execution Status Chart
The chart is displayed in the report as shown below:
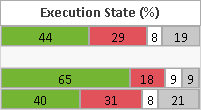
Execution State in %
Requirement Coverage Executed Chart
For RequirementSets and Requirements, you can display the cells from the Coverage Executed (%) column in your report.
To correctly display this chart, select the CoverageExecuted attribute for the object types RequirementSets and Requirements.
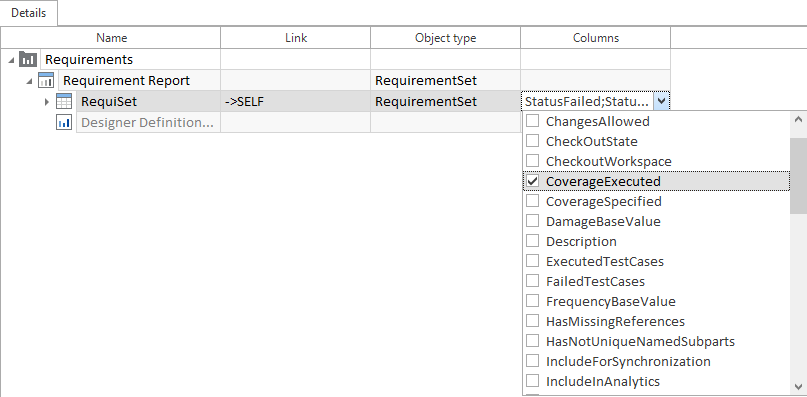
RequirementSet attribute for Requirement Coverage Executed Chart
The chart is displayed in the report as shown below:
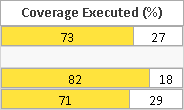
Coverage executed in %
Requirement Coverage Specified Chart
For RequirementSets and Requirements, you can display the cells from the Coverage Executed (%) column in your report. To correctly display this chart, select the CoverageSpecified attribute for the object types RequirementSets and Requirements.
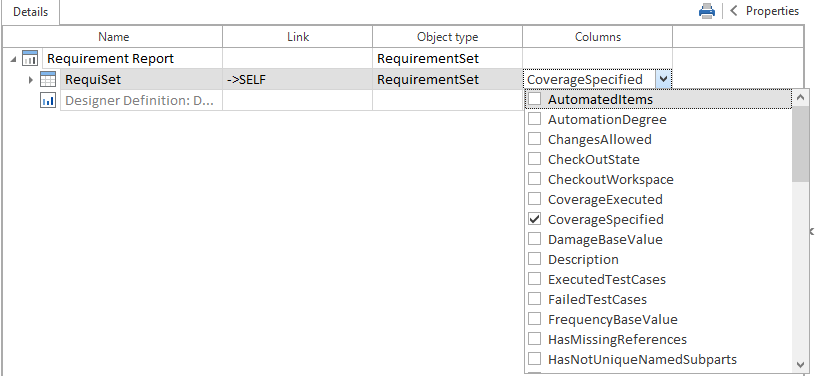
RequirementSet attribute for Requirement Coverage Specified Chart
The chart is displayed in the report as shown below:
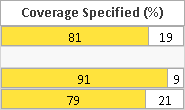
Coverage specified in %