Dashboard metrics
When you work with a dashboard, you'll see that every test result splits its metrics into two categories: User paths and Monitors. They represent two different sides of the same test run: the experience of your virtual users, and the infrastructures that generate the load and support the tested application.
Combine both categories in the same dashboard to correlate a change in one with a change in the other, such as a response time spike that lines up with a CPU spike on the database server.
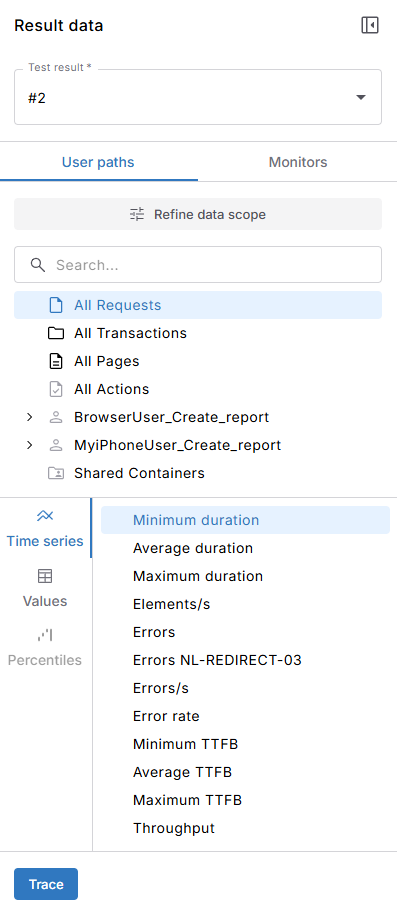
Click to enlarge: The User paths section of the test data panel
Each metric in these categories can appear on a dashboard as a series, a value, or a percentile, depending on the tile you use. All of them update live as the test runs, except for scatter duration.
User paths
User paths metrics measure the virtual users' experience: the scripted business transactions, or scenarios, that your load generators replay during the test. They include all requests, all transactions, and all pages in your test, as well as each of these broken down per individual user path.
For each element, you can track the following metrics:
-
Minimum duration: The minimum response time for the element.
-
Average duration: The average response time for the element.
-
Maximum duration: The maximum response time for the element.
-
Element/s: The number of times the element runs per second.
-
Elements: The number of times the element triggers during a test run with its successes and failures.
-
Throughput: The amount of data the element receives from the server, in megabytes.
-
Minimum TTFB: The minimum Time to First Byte (TTFB), the time between sending a request and receiving the first byte of its response.
-
Average TTFB: The average TTFB for the element.
-
Maximum TTFB: The maximum TTFB for the element.
-
Errors: The number of failed executions of the element.
-
Errors by code: Each error code that the run produces is available as its own metric, so you can pinpoint the cause of failures.
-
Errors/s: The number of failed executions per second.
-
Error rate: The percentage of executions that failed.
For transactions, two more metrics reveal how response times distribute across the test:
-
Duration percentiles: Available for all transactions. It shows the response time below which a given percentage of executions fall, at the 50th, 90th, 95th, and 99th percentile. For example, a 90th percentile of three seconds means 90% of executions finished in three seconds or less.
-
Scatter duration: Available for individual transactions. It plots every transaction execution as its own point instead of averaging it into a line. Use it to see how individual executions relate to time and load and spot outliers that an average hides.
Keep the following in mind when you use scatter duration:
-
For results with many transaction executions, NeoLoad uses the blue noise sampling technique. The graph keeps outliers and the overall shape but reduces the density. As a result, one point represents more than one execution. Each point carries a weight that shows how many nearby raw points it represents. Hover over a point to see more details.
-
It's a series metric, so you can combine it with other series metrics in the same tile.
-
The metric only includes results from finished tests, not from tests that are still running.
-
The metric uses raw data, which NeoLoad retains for
Monitors
Monitors metrics measure the infrastructure behind your test, not the virtual users' experience. This infrastructure falls into two categories:
-
Load generation infrastructure: The controller and load generators that NeoLoad uses to run your test. NeoLoad always monitors this infrastructure: virtual user load, throughput, alerts, and the hardware, memory, and network usage of your load generators.
-
Application infrastructure: The infrastructure that supports your application, such as its operating system, database, network, web server, or application server. You can also connect third-party monitoring tools, such as Dynatrace or Datadog. NeoLoad doesn't have access to this infrastructure by default. To monitor it, configure the components you want to track in NeoLoad and grant access to them.
Monitoring your application's own infrastructure lets you find the root cause of a performance issue. For example, if a user path's response time spikes, check whether a server behind it was overloaded at the same time.
What's next
Now that you know what metrics your dashboards can track, Create custom dashboards to combine user paths and monitors metrics in the same view.