Overview tab
The Overview tab presents all basic details of a test. Most importantly, it displays all the test run results in a graph and list view.
To access the tab, click Tests in the left navigation panel. In the list of tests, click on a test of your choice.
The Overview tab contains the following components:
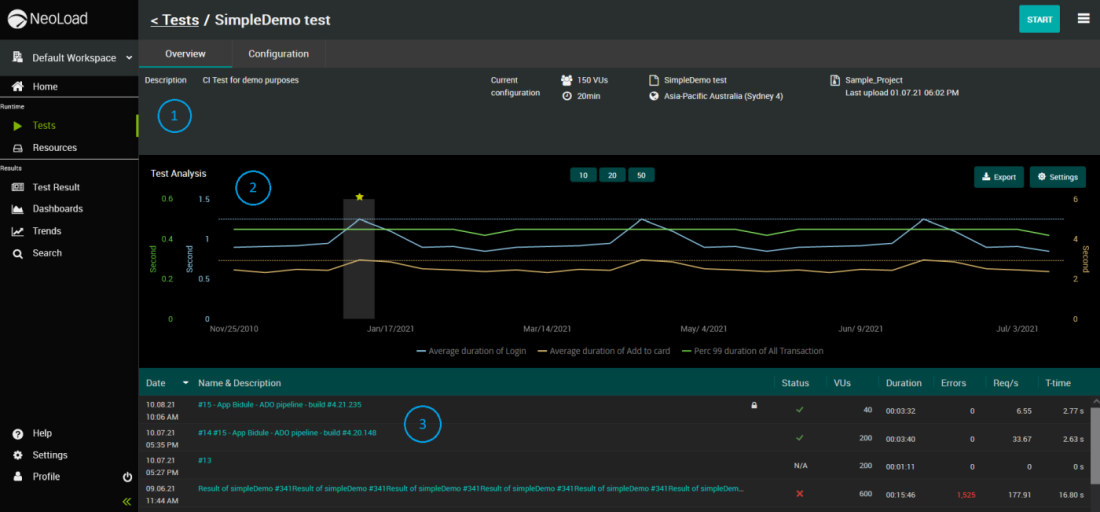
 A summary panel with key details of the test. The description is editable when you click on it.
 A graph view of the test runs. Each node represents one test result. A reference test result is marked with a little star. The buttons above the graph allow you to display either 10, 20, or 50 nodes (latest test runs). If you hover over a node, you will see a summary of that test result, including difference from the reference test in %.
The graph can have one to three main lines that represent metrics of your choice, and one to three secondary lines (dotted) that represent baselines defined by the reference test result. You can show/hide the lines by clicking on their legend below the graph.
To access rich options to configure the graph view, use the Settings button.
To save the current graph view as a CSV or PNG file, use the Export button.
 A list view of the test runs. By default, the latest results are displayed on top. Click on a test run name to see full test result details.