Global execution progress
The Global execution progress report provides an overview of test result statistics across all projects in your account as well as details on a selected project, cycle, and folder. The report helps you monitor the overall success rate of your testing activities, while allowing you to drill down to a specific project. This lets you identify quality bottlenecks, so you can quickly communicate them to your development teams.
To access the report, go to Reports > Global execution progress. This opens an interactive dashboard, that displays while displaying the data of the last seven days:
-
Account level execution progress: displays summary information for all projects in the account. Each pane displays test run results summaries, such as how many tests passed, failed, and so on.
-
Project level execution progress: displays test execution statistics for the selected project. You can drill down to view the details of the lower levels in the project hierarchy, such as project, version, cycle, or folder.
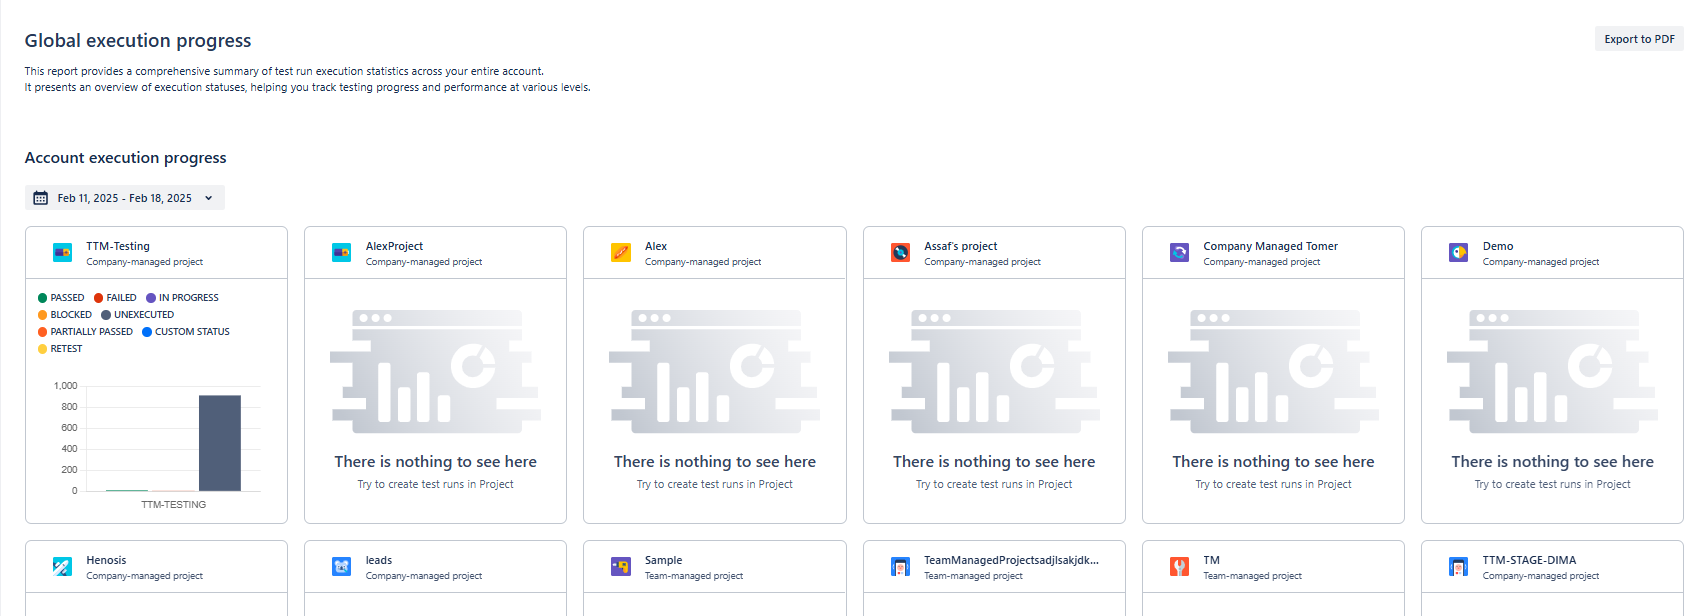
Global execution progress dashboard
Project level execution progress
This section displays summary panes for all projects in the account. By default, the data of the last seven days is displayed, but you can change the reporting period.
Each pane includes a bar chart with the test run results of the specific project.
The graph displays the following details:
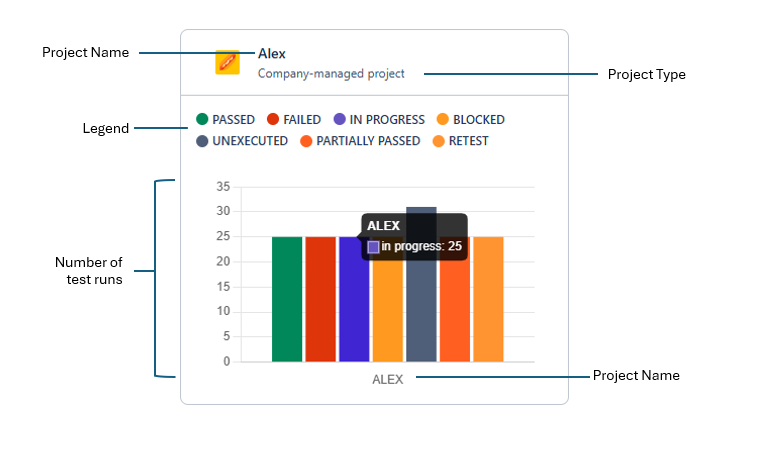
Execution summary pane
-
The bars are colored according to the legend. The colors represent the statuses of the tests runs (how many tests passed, failed, etc.).
-
The vertical axis represents the number of test runs.
-
Hover over the bar to display the number of test runs.
Account level execution progress
This section displays test execution statistics for the selected project. You can drill down to view the details of the lower levels in the project hierarchy, such as project, version, cycle, or folder.
Define which data you want to see
Tricentis Test Management for Jira only populates this dashboard if you specify which data you want to see. To specify the data:
-
Select the time frame of the report. The data of the last seven days is displayed by default.
-
Select a Project from the drop-down menu and select Done.
-
You can optionally filter the data to include Released/Unreleased versions only.
Drill down
Drill down the hierarchy to get detailed information:
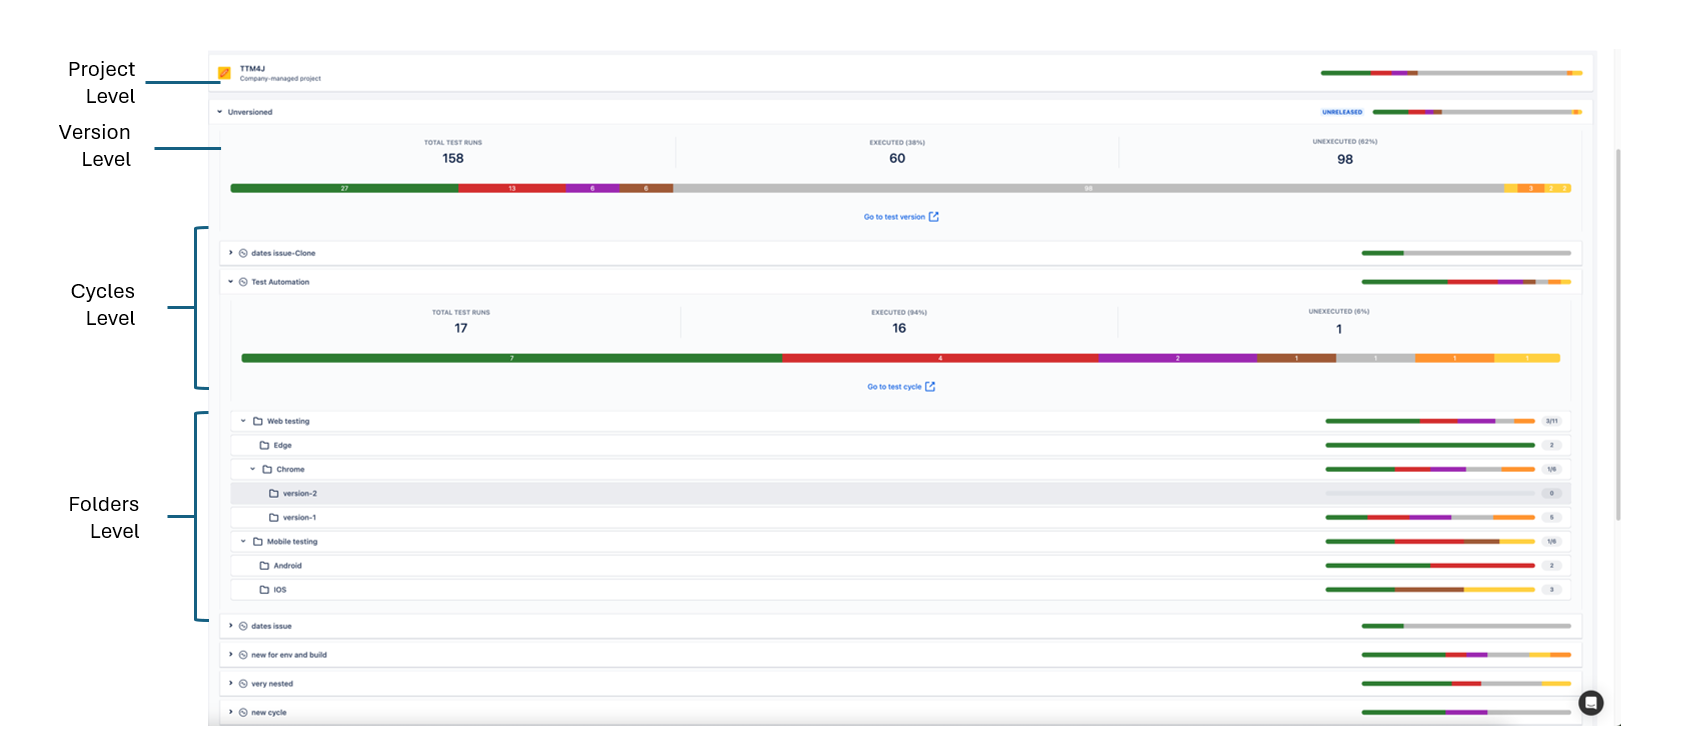
Project hierarchy
-
Project level: displays the Project name and Project type as well as the test execution summary bar. Hover over the bar to see the number of test runs.
-
Version level: displays the test versions in the project. Test runs that don't have a specific version are listed under Unversioned. Hover over the bar to see the number of test runs, or expand the view to see additional details such as the number and percentage of tests you ran.
-
Cycles level: displays the cycles in the project. Hover over the bar to see the number of test runs, or expand the view to see additional details such as information on a particular test cycle.
-
Folders level: displays the folders in the cycle. Hover over the bar to display the number of test runs, or expand the view to see additional details such as number of test runs in a specific folder.
Share your report
Data isn't as useful if you're the only one that sees it. You can easily share whatever view you create:
-
To share data with people who have access to your Jira project, give them the URL of your Global execution progress report.
-
To share data with people who don't have access—or people who just prefer PDFs—select Export to PDF.
What's next
You're familiar with the test metrics dashboard. If you're curious about other dashboards to monitor your data, check out "Analyze tests".