Jira Defects in Portfolio Reporting
Portfolio Reporting allows for a streamlined approach to viewing and interacting with Jira Defects through the following features:
If you have a Jira integration you can also use the following with Portfolio Reporting:
-
Map Defect Custom Fields: Allows you to select your custom Jira defect fields that you want to see in the Portfolio Details table of the Portfolio Overview report.
-
Map Defect Status Values: Map your Jira Defect Status Values to Insights Status Values. You can also assign a color to the Insights Value which will display in your Portfolio Reports.
-
Map Jira Defect Severity Values: Allows you to translate defect severity values defined in Jira to a set of standard severity values in Insights. making it easy to clean up multiple prioritization values that may exist in your Jira projects.
Mapping Jira Defect Severity Values
This feature allows you to translate defect severity values defined in Jira to a set of standard severity values in Insights. This allows for an easy standardization of defect severity values across all Jira projects integrated with qTest.
This feature is useful for teams who work with multiple Jira projects simultaneously, and where each Jira project may have different defect severity values (names).
Often, these values will be different in name, but very similar in actual severity. This can happen when Jira projects are defined across an organization (or even subsections of an organization), with multiple projects, and standardization was not implemented.
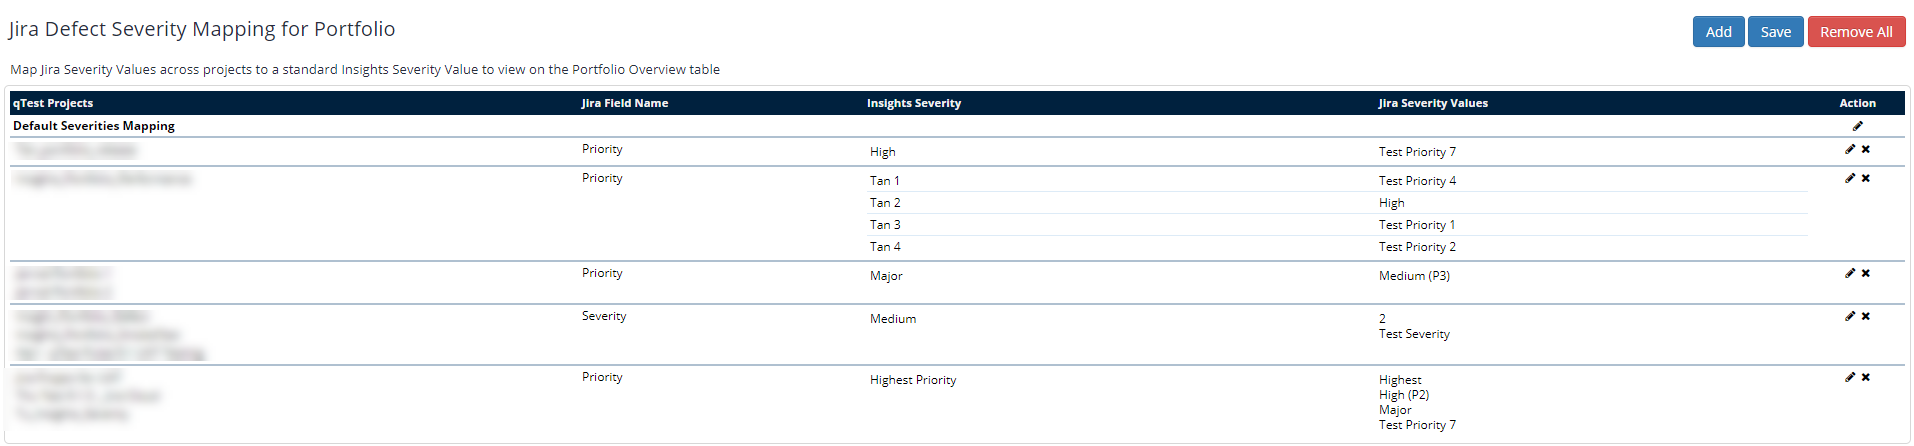
Example: Your Portfolio has four projects and their highest level of severity values are all different names, yet, in reality, they mean the same thing.
-
Project 1=severity value of 'Highest'
-
Project 2=severity value of 'High (P2)'
-
Project 3=severity value of 'Major'
-
Project 4=severity value of 'Test Priority 7'
Therefore, you want to map these differing values to one defect severity value in Insights, such as 'Highest priority,' so you can easily view these defects in one column on the Portfolio Overview table.
Where will I see the Jira severity mapping?
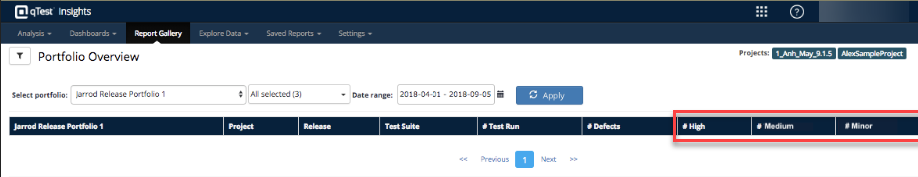
You will see the benefit of the Jira severity mapping when you view the Portfolio Overview section of the Report Gallery.
Before you map your defect severity values, the Portfolio Overview table shows the number of defects that fall within your Jira-defined defect severity values. If a portfolio includes many projects, each with many different severity values, tracking this information becomes difficult, as it displays the number of defects falling within each severity value.
In the example above, before defect severity mapping, the table would show the number of defects that have severity values of 'High,' 'L1,' 'Important,' and 'Show Stopper' in separate columns although they are 'in reality' synonymous. After mapping, the table would only show these defects as falling under the new standard value of 'High.'
Jira Defect Severity Mapping Video
Watch the video in full screen to get the best picture quality.
To use this feature:
-
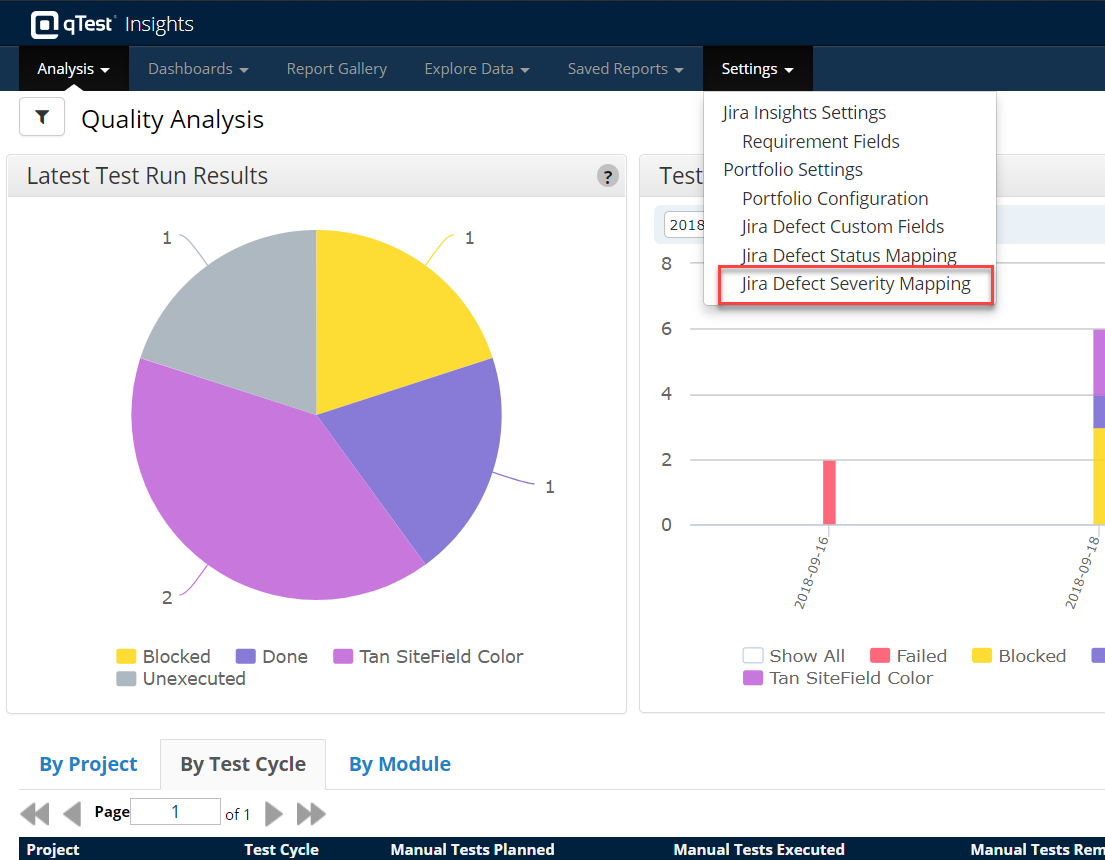
From Insights, select the Settings tab.
-
In the drop-down menu, select Jira Defect Severity Mapping.
-
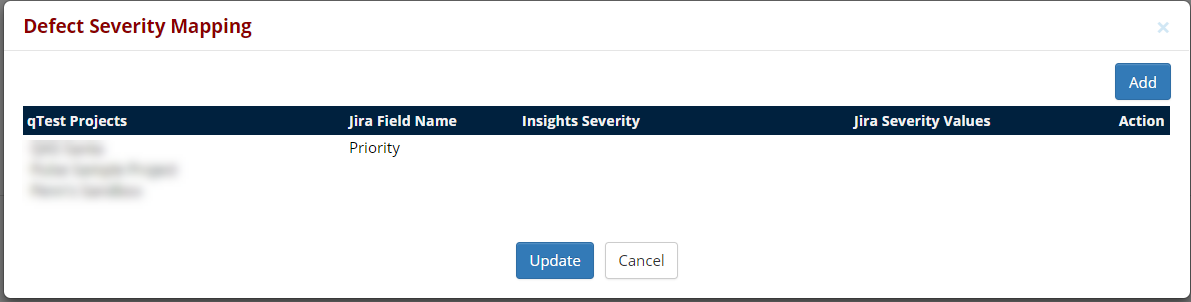
The Jira Defect Severity Mapping for Portfolio page displays.
Add a New Defect Severity Mapping
-
Select Add, and the Projects for Defect Severity Mapping dialog loads.
-
Use drag and drop to move your Jira integrated qTest projects from the Available Projects field into the Selected Projects field so that you can map defect severity for the selected projects. Select OK.
-
The Jira Severity Field dialog displays. Here, select the field name associated with tracking severity values in your Jira instance.
The values you see in the Field Name drop-down menu are populating from your Jira projects associated with the selected qTest Projects. The field most commonly used is "Priority." However, if your team has made a custom field to track defect severity in Jira. choose that value from the drop-down menu.
-
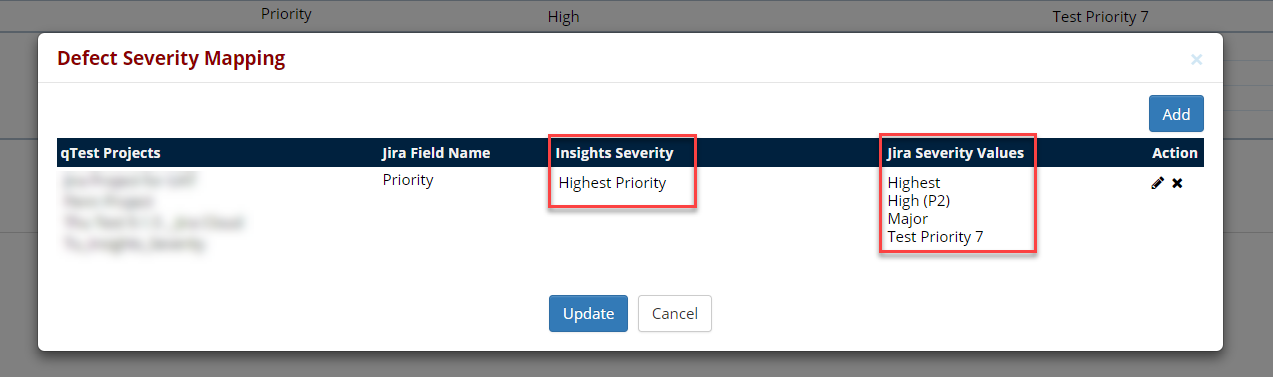
Select Add, and the Defect Severity Mapping Entry dialog opens.
-
Enter and assign the following:
Insights Severity Name: The standardized severity name that you want to display in Insights
Jira Severity Values: Your predefined Jira Severity Values which are pulling from your Jira instance.
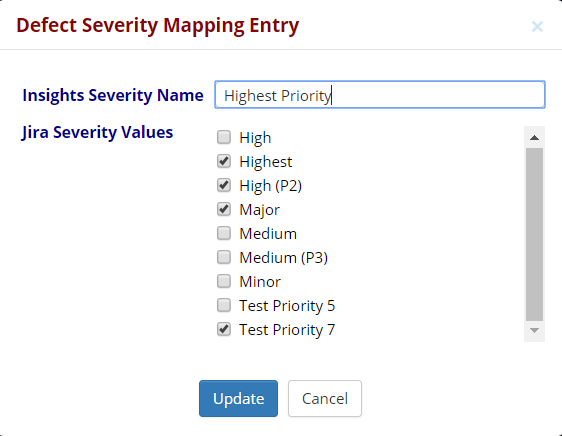
ONLY values that have been assigned to a defect in Jira will populate in Insights. Insights will not pull a defect severity value that has not yet been assigned in Jira because it will not require mapping if it is not being used. You will see standard Jira fields along with your custom Jira fields that are associated with a 'Priority field name.'
-
Select Update, and the defect severity mapping entries save. Your combined selections display in the Defect Severity Mapping table.
-
Continue the add process until you have mapped all of the desired Jira severity values to a standard Insights severity value. The Add button will disable once all of the Jira severity values are assigned.
-
Once you have entered all of your severity mappings, select Update again in the Defect Severity Mapping dialog.
To better prioritize your defects, try defining severity values on a graded scale. For example, a defect that might not present a significant issue could have a severity value of "Moderate" while a much more serious defect might have a severity value of "Critical."
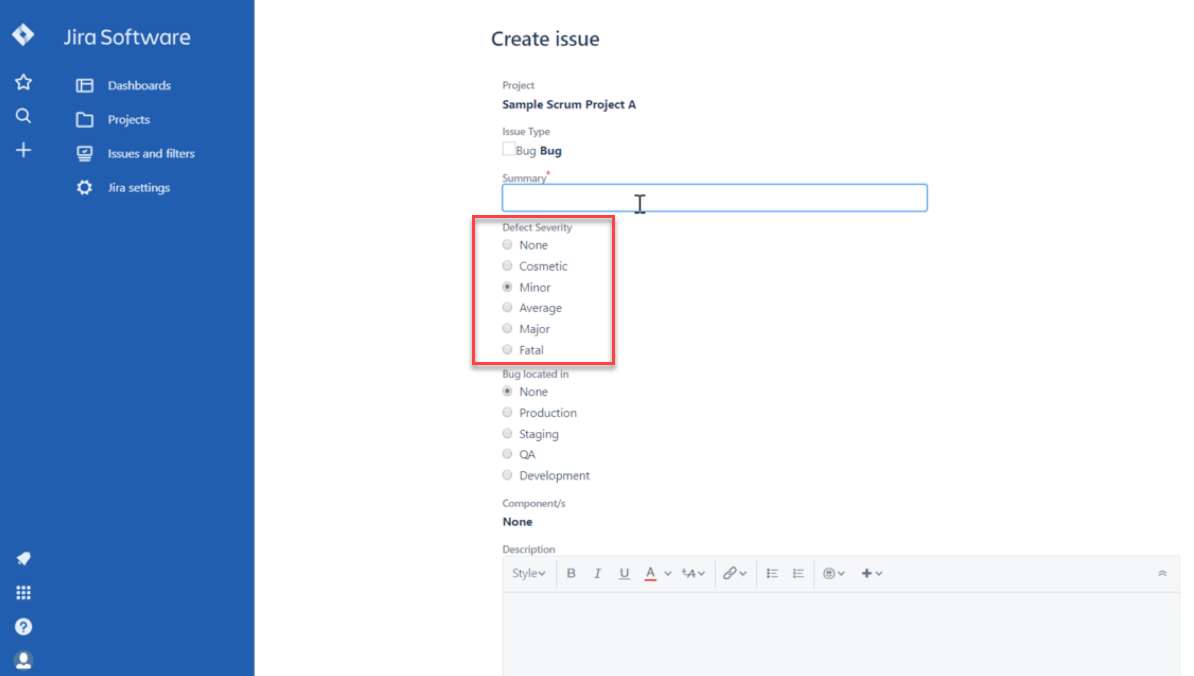
Example Use Case
In this Jira project (we will call it Project A), the user had defined custom defect severities using the values "None," "Cosmetic," "Minor," "Average," "Major," and "Fatal." Consider that there is a project in qTest integrated with this Jira instance so that these defect severity values now show in qTest Insights as well.
Perhaps the user also has a Jira project, project B, in which the Defect severities are defined as values "Not important," "Of little importance," "Approaching important," "Important," "Very important," and "Fix immediately." Like Project A, there is a project in qTest integrated with this Jira instance. While the actual levels of severity might be the same as in project A, the defined values (names given to severity levels) differ. This could be the case between ten different Jira projects, with each having different values for similar grades of severity.
To simplify defect analysis and reporting, qTest Insight allows the user to map all of these different values in Jira projects A and B onto a standard set of severity values in the Portfolio Report. With this feature, teams can potentially standardize dozens of differing severity values into one set of streamlined values, cleaning up both qTest and Jira environments.
For example, the user could map the severity values "Cosmetic" and "Of little importance" onto an Insights severity value of "Low priority." Upon doing so, the defect severity value of both defects would show up in the Portfolio Report as having a severity value of "Low priority." These new values would show up in the Portfolio Overview section of the Report Gallery.
Edit Existing Defect Severity Values
-
To edit a mapping, select the pencil icon in the Action column under the Action section in the Jira Defect Severity Mapping for Portfolio table. Choose the pencil icon that corresponds with the severity level value that you want to change.
-
The Defect Severity Mapping dialog opens. Select the corresponding pencil icon in the Action column.
If editing, input the new Insights severity name in the corresponding text field and then select the check box next to the Jira severity values that you want to change. Select Update.
Jira Defect Custom Fields
This new feature allows you to select your custom Jira defect fields that you want to see in the Portfolio Details table of the Portfolio Overview report.
To use this feature:
-
From Insights, select the Settings tab.
-
In the drop-down menu, select Jira Defect Custom Fields.
-
The Jira Defect Custom Fields for Portfolio Report page displays.
-
Use drag and drop to move your custom Jira fields from the Available Jira Fields section into the Selected Jira Fields section. Select OK.
-
Once you add a custom Jira field to the Selected section, you have the opportunity to edit the column header name that will display in the Portfolio Details table.
You can also edit the column Type. Select the pencil icon in the Action column to open the Jira Defect Field dialog.
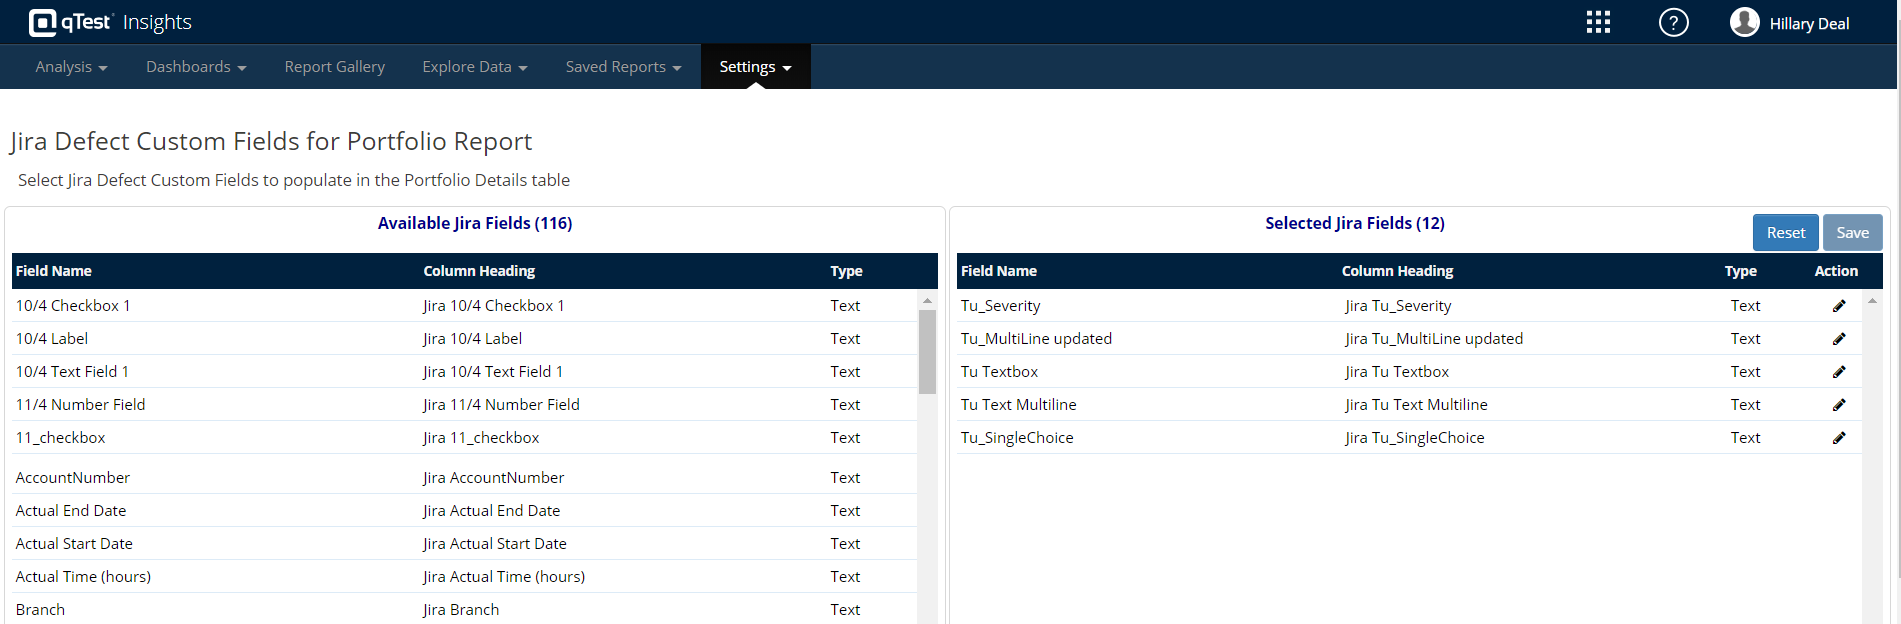
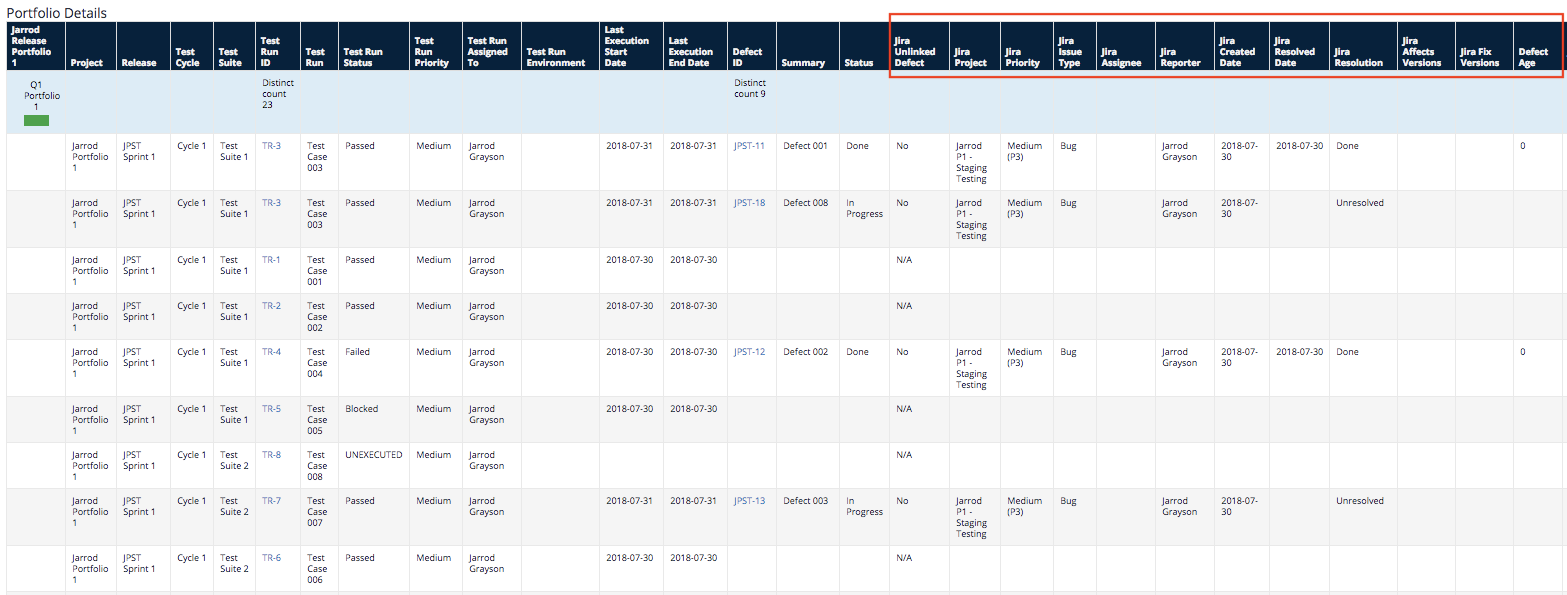
Once finished, your new Defect custom fields populate in the Portfolio Details table in the Portfolio Overview section of Report Gallery.
Jira Defect Status Mapping
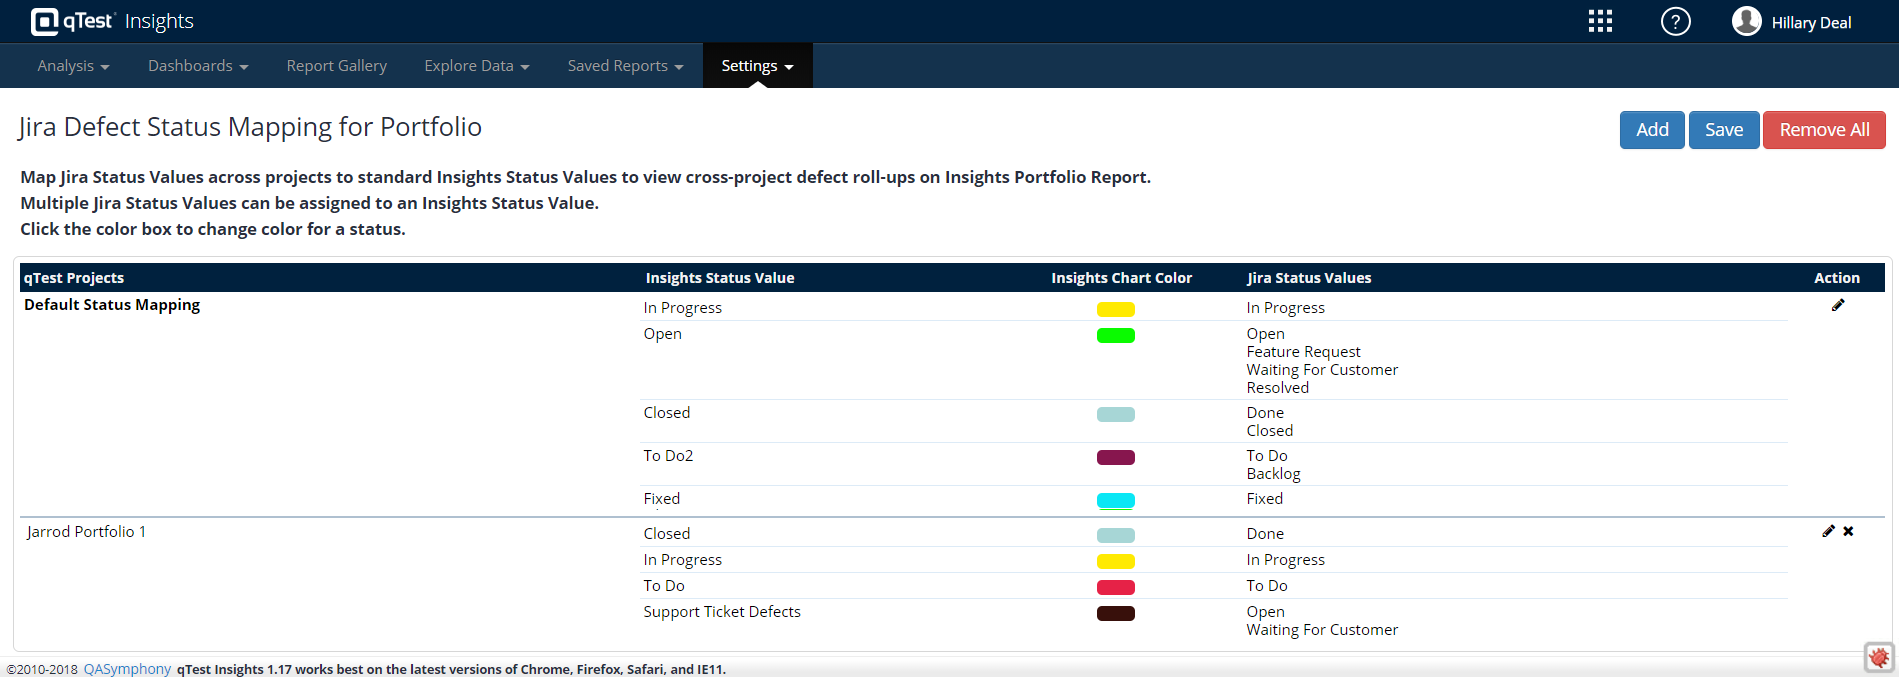
You will need to map Jira Status Values across your qTest Projects, with a standard Insights Status Value. This mapping allows you to view cross-project defect roll-ups, at the portfolio level, within Insights Portfolio Report. Like the Defect Severity Mapping, you can assign multiple Jira Status Values to one Insights Status Value. Also, like Defect Severity Mapping, this feature allows testers to standardize potentially mass amounts of different values into one simple set of values. This allows for a much more streamlined testing environment.
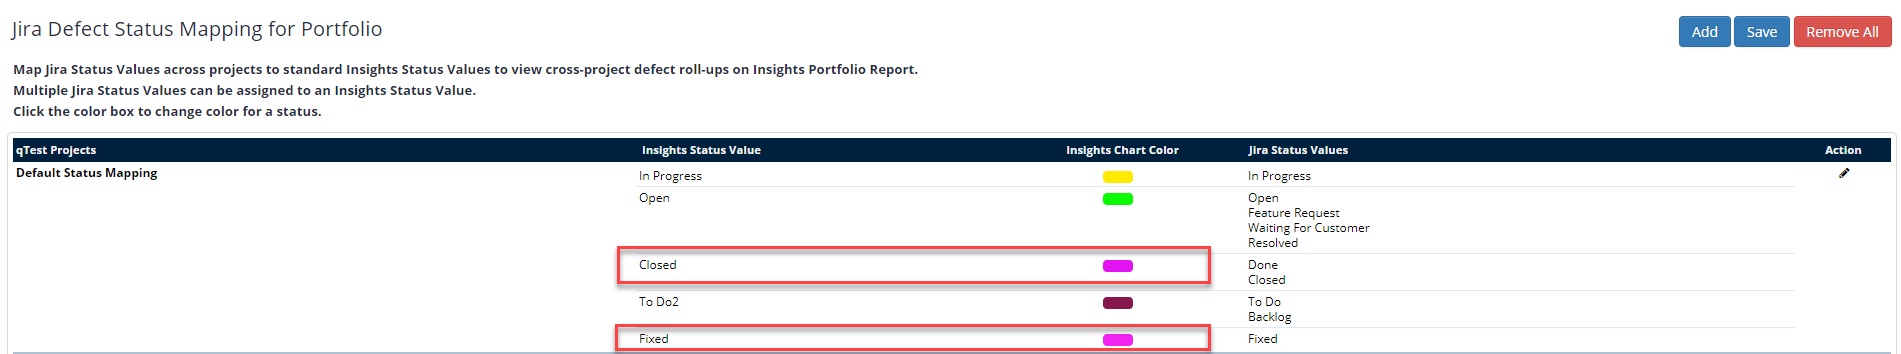
The Insights Chart Color you select here will link the Insights Status Value to a chart color across all projects using Portfolio Reporting. The chart color is not limited to only one status, but you cannot have one status assigned to multiple colors.
Example: The Insights Status Values of Closed and Fixed are both assigned the same Insights Chart Color pink. Therefore, all Closed and Fixed statuses will be assigned a chart color of pink across all Portfolio Charts.
To use this feature, do the following:
-
From Insights, select the Settings tab.
-
Select the Jira Defect Status Mapping option, and the page will load.
-
The Defect status Mapping will display in the table.
Jira Defect Status Mapping Video
Watch the video in full-screen for the highest quality viewing.
Add a New Defect Status Mapping
-
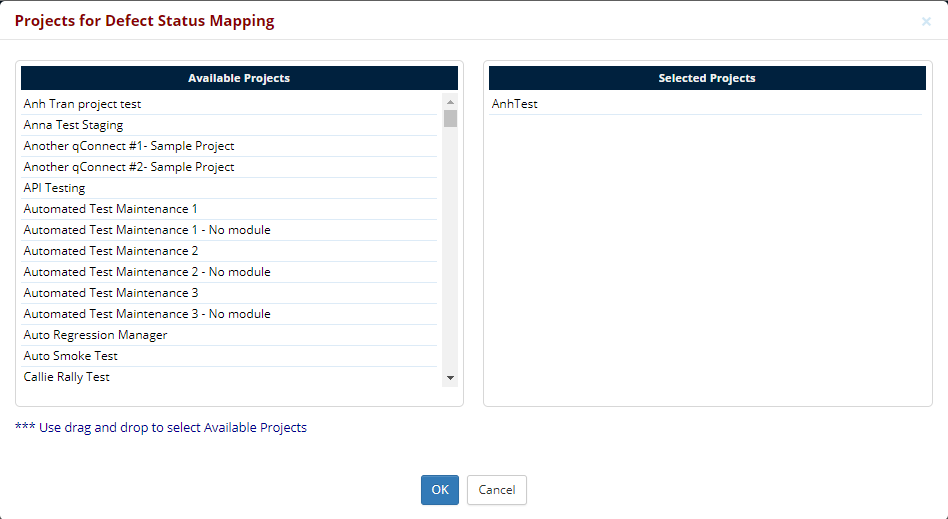
Select Add and the Projects for Defect Status Mapping dialog loads.
-
Locate the desired projects from the Available Projects column and use drag/drop to move it to the Selected Projects column.
-
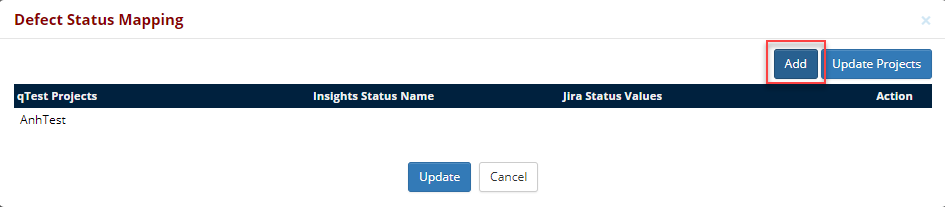
Select OK, and the Defect Status Mapping dialog will populate with the new qTest Projects you selected.
-
Select the Add button to map the Insights Status Value with the Jira Status Value.
-
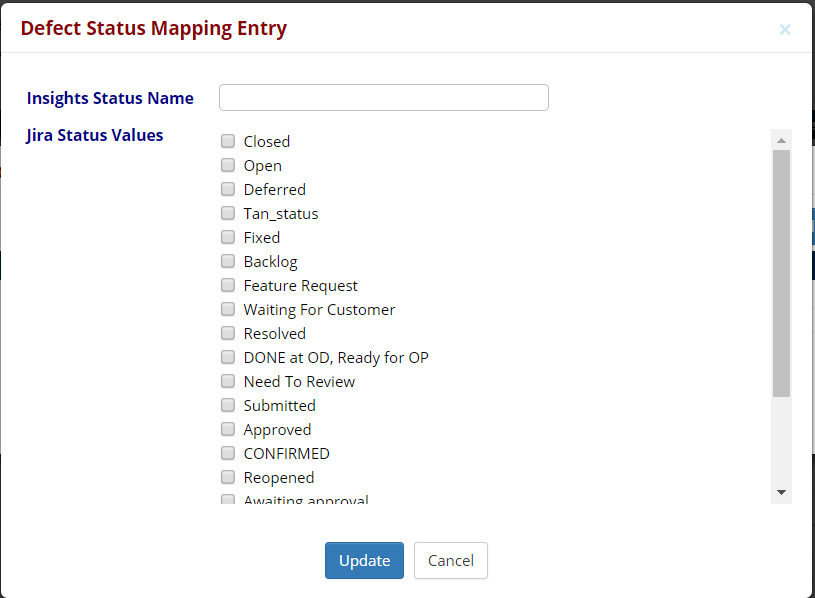
The Defect Status Mapping Entry dialog opens, and you will enter or assign the following:
-
Insights Status Value: The standard name that will display in Insights
-
Jira Status Value: Your Jira Status Values
-
-
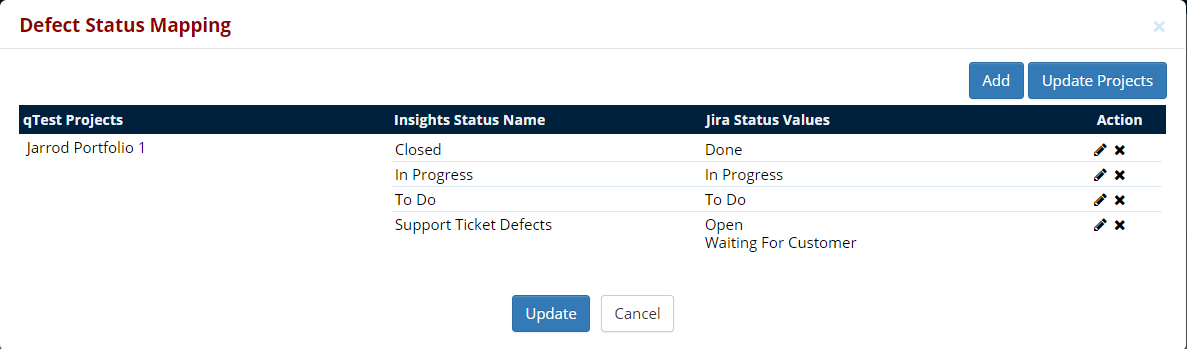
Select Update and the Defect Status mapping entries will save. Your combined selections will display in the Defect Status mapping table.
-
Once you have entered all of your status mappings, select Update in the Defect Status Mapping dialog and the Projects with their assigned values and mappings will display in the Jira Defect Status Mapping for Portfolio table.
Edit Existing Defect Status Mappings
-
From Insights, select the Settings tab.
-
Select the Jira Status Mapping option and the page loads.
-
Locate the qTest Projects you would like to edit and select the pencil icon in the Action column.
-
The Defect Status Mapping dialog will open, and you can edit the Projects by selecting the Update Projects button.
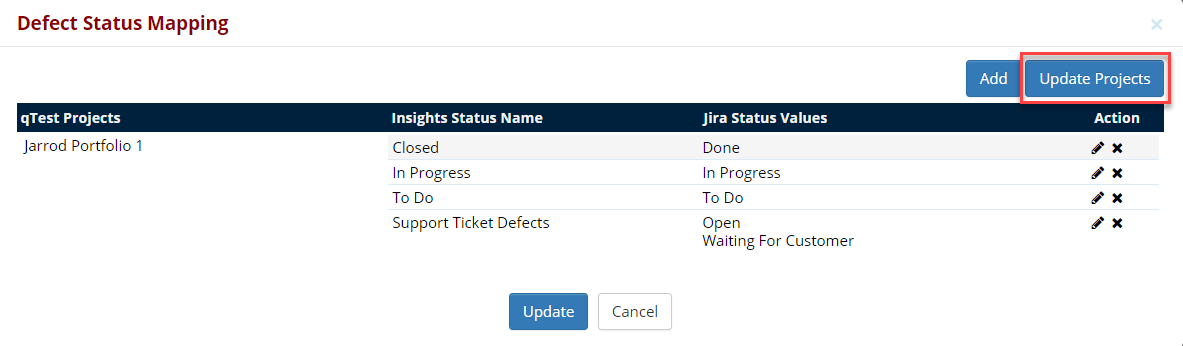
-
The Defect Status Mapping dialog opens, and you can use drag/drop to edit the Selected Project column by either adding additional projects or removing existing ones.
-
Select Ok, and the Project Mapping will update on the Default Status Mapping dialog.
-
Select Update and the Jira Defect Status Mapping for Portfolio page will load with your new changes.
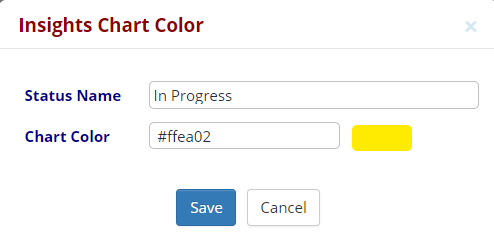
Assign an Insights Color Value
-
On the Jira Defect Status Mapping for Portfolio page, select the chart color in the Insights Chart Color column.
-
The Insights Chart Color dialog opens, and you can enter the varchar Chart Color, or select the color tile and visually choose the desired color. Click Save.