Test Cases Dashboards
| qTest, Tosca, or both | Chart Name | What is This Chart, and Why Use it? | Chart image in Insights | Business Rules |
|---|---|---|---|---|
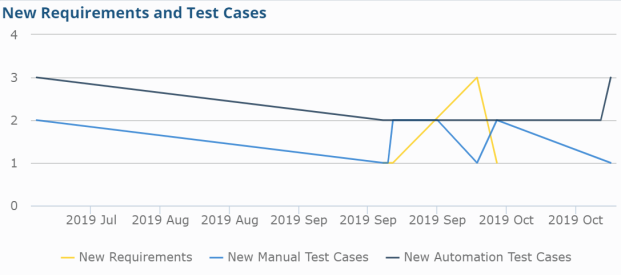
| qTest | New Requirements and Test Cases (also in Requirements dashboard) |
A line graph that tracks and displays new Requirements, new manual Test Cases, and new automated Test Cases by month |
|
This chart shows the number of Requirements, manual Test Cases, and automated Test Cases by day. For the Test Cases, the type (manual or automated) is the latest updated type. Only shows the point at the dates on which at least 1 requirement or test case is created. X axis: Date Y axis: Quantity of Requirements or Test Cases |
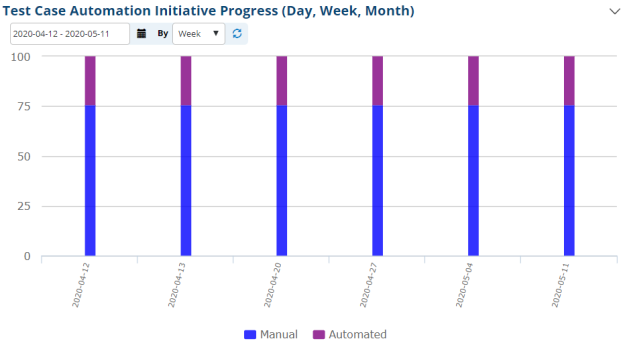
| qTest | Test Case Automation Initiative Progress (Day, Week, Month) (also in Automation dashboard) |
A stacked bar graph that shows the amount of Test Cases that are either manual, automated, or both. This data is tracked by day, week, or month. |
|
This chart shows the correlation between the percentage of automated and manual Test Cases. Count of Test Cases is accumulative. |
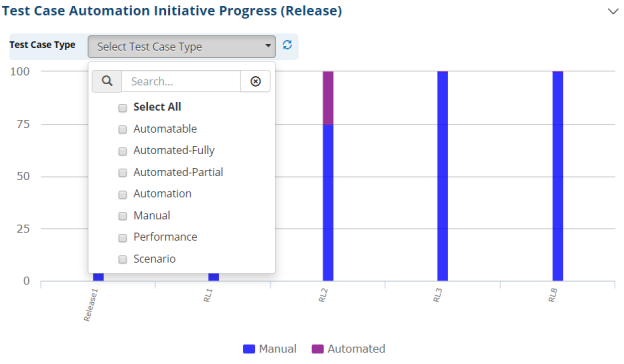
| qTest | Test Case Automation Initiative Progress (Release) (also in Automation dashboard) |
A stacked bar graph that shows the amount of Test Cases that are either manual, automated, or both. This data is tracked by Release. |
|
X-axis: Releases Y-axis: Percentages of automated Test Cases and manual Test Cases |
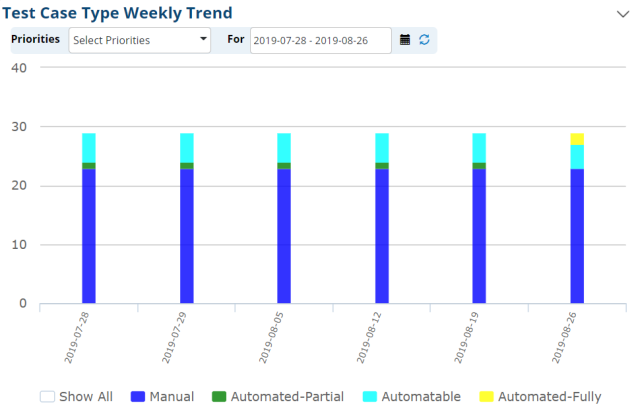
| qTest | Test Case Type Weekly Trend | A stacked bar chart that tracks, compares, and displays the amount of Test Cases of certain types per week. This allows you to see the general trend of Test Case Types over a weekly basis. |
|
This chart counts Test Cases for every Test Case type change from the 1st date the type is changed. For a date without changes, data will be populated from the previous change data. |
| qTest | Test Case Type Weekly Trend (%) | A stacked bar chart that tracks, compares, and displays the percentages of Test Cases of certain types per week. This allows you to see the general trend of Test Case Types over a weekly basis. |
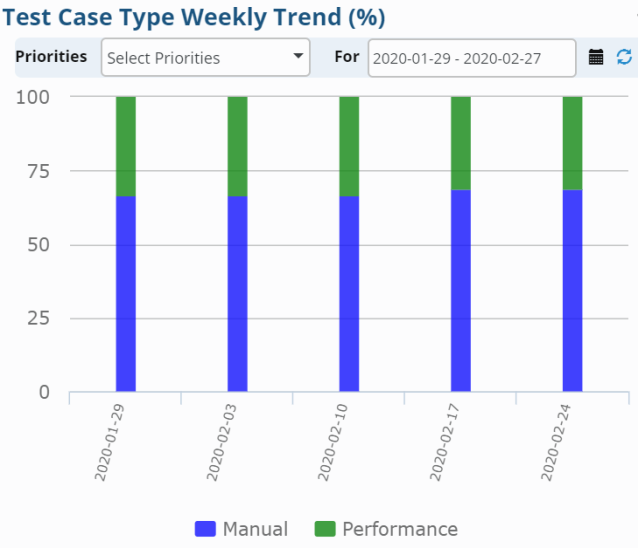
|