Defects Dashboards
| qTest, Tosca, or both | Chart Name | What is This Chart, and Why Use it? | Chart image in Insights | Business Rules |
|---|---|---|---|---|
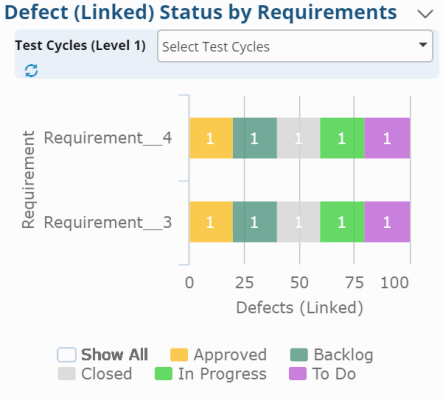
| qTest | Defect (Linked) Status By Requirements (also in Requirements dashboard) |
A chart that displays Linked Defect Statuses per Requirement |
|
This chart counts defects by associated requirements, break down is by defect status |
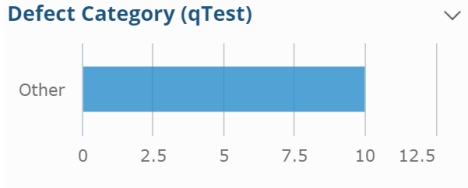
| qTest | Defect Category (qTest) | A horizontal bar graph that displays the amount of qTest Defects by Defect Category |
|
Presents the number of qTest defects grouped by category |
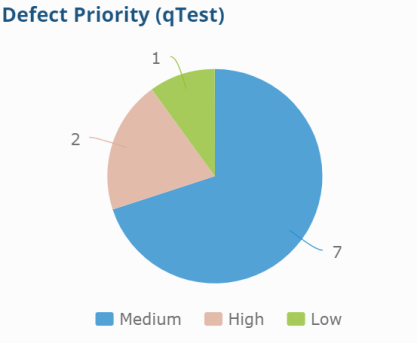
| qTest | Defect Priority (qTest) | A pie chart that displays the amount of qTest Defects by Priority Level. |
|
Presents the number of qTest defects grouped by priority |
| qTest | Defect Root Cause (qTest) | A horizontal bar graph that displays the amount of qTest Defect Root Causes | Presents the number of qTest defect grouped by root cause | |
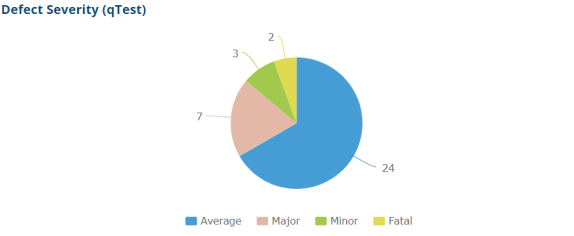
| qTest | Defect Severity (qTest) | A pie chart that displays the amount of qTest Defects by Severity value |
|
|
| qTest | Defect Status (External) | A pie chart that displays the amount of External Defects by Defect Status value |
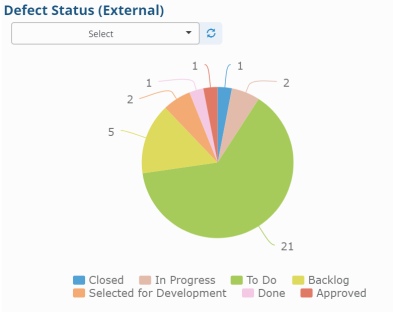
|
Counts external defects by status. Can filter chart by external defect type (Jira linked, Jira unlinked, Rally, VersionOne) |
| qTest | Defect Status (Linked) | A pie chart that displays the amount of Linked Defects by Defect status Value |
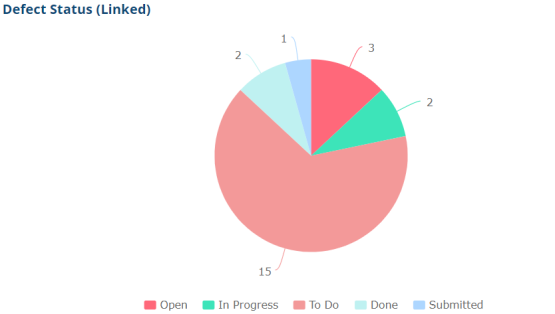
|
Counts the distinct number of linked issues (field: externalIssueId) and grouped by base on externalIssueStatus. Width of the pie: Number of linked defects Group: externalIssueStatus |
| qTest | Defect Status (qTest) | A pie chart that displays the amount of qTest Defects by Defect Status Value | ||
| qTest | Defect Status Trend (qTest) | A stacked bar graph that tracks and displays Defect Status trends over a set time. |
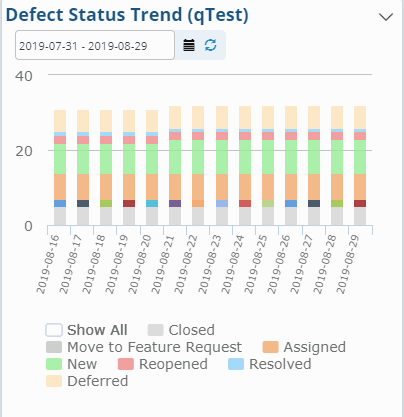
|
Counts defects for every history defect status from the 1st date when a defect is changed. For the date without changes, data will be populated from the previous change data. |
| qTest | Defect Type (Linked) | A pie chart that displays the amount of linked Defects by Defect Type |
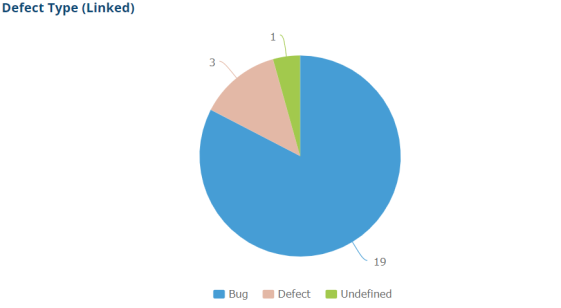
|
Counts the distinct number of linked defects (field: externalIssueId) and grouped by base on external defect type (get from defect_tracking_type or integration_type_maps) Width of the pie: Number of linked defects Group: externalIssueStatus |
| qTest | Defect Type (qTest) | A pie chart that displays the amount of qTest Defects by Defect Type | ||
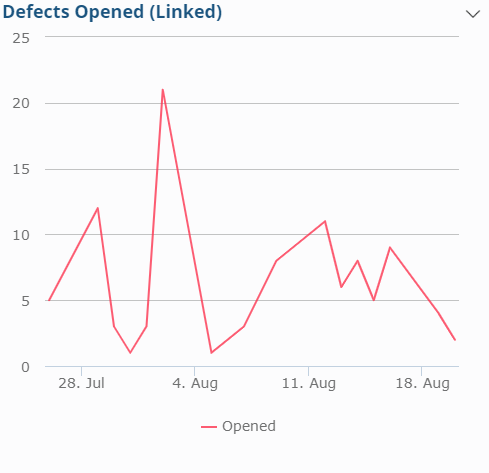
| qTest | Defects Opened (Linked) | A line graph that displays the amount of Linked Defects that have been opened over a set amount of time |
|
Counts Linked external defects by the date they were submitted from qTest, regardless of the defect's current status X-axis: ExecutionStartDate of the Test log to which the defect linked Y-axis: Number defects (linked Jira, Rally, VersionOne) created on the date of x-axis |
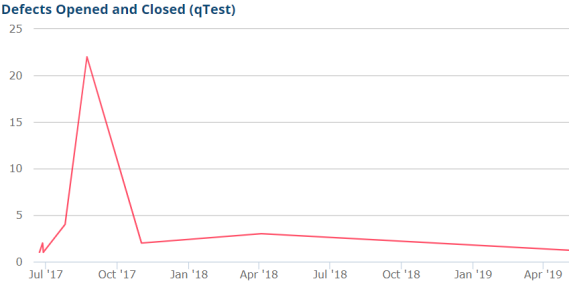
| qTest | Defects Opened and Closed (qTest) | A line graph that displays the amount of qTest Defects that have been both opened and closed over a set amount of time |
|
The red line is the number of opened defects corresponding to the date in X-axis. The green line is the number of closed defects corresponding to the date in X-axis. |
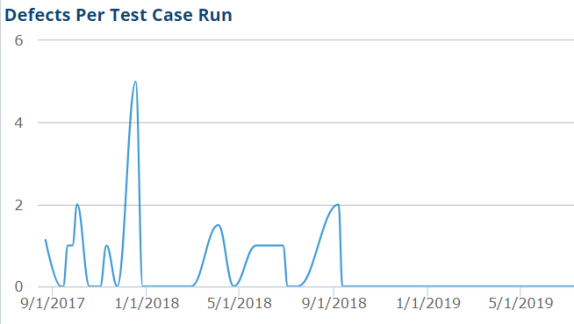
| qTest | Defects Per Test Case Run | A line graph that displays the amount of Defects per a given Test Case Run over a set amount of time |
|
Y-axis: Average number of defects per Test Run (defectcount/runcount) |
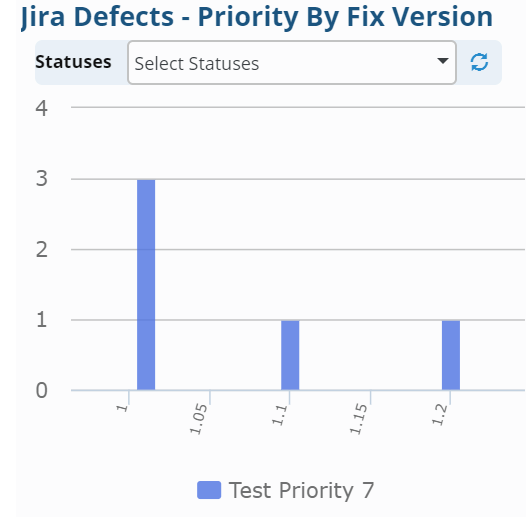
| qTest | Jira Defects - Priority By Fix Version | A bar chart that tracks, compares, and displays the amount of Jira Defects with certain Priority values per Fix Version |
|
Presents the number of Jira defects in each Fix versions grouped by priority |
| qTest | Module Defects Coverage | A mosaic chart that displays the amount of Defects and Test Cases per module |
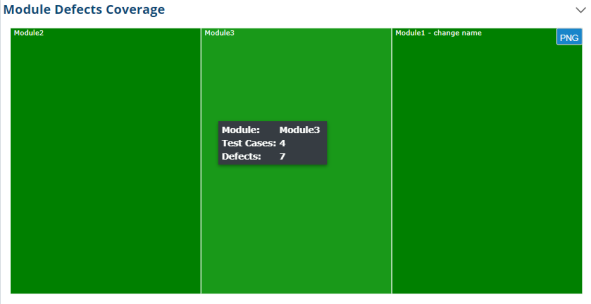
|
Size of segments: Number of Test Cases Color: Number of Defects (highest is red, lowest is green) Grouped by Modules |
| qTest | Open Defect (Linked) Priority by Project | A horizontal stacked bar graph that displays the amount open Linked Defects by Priority level per project |
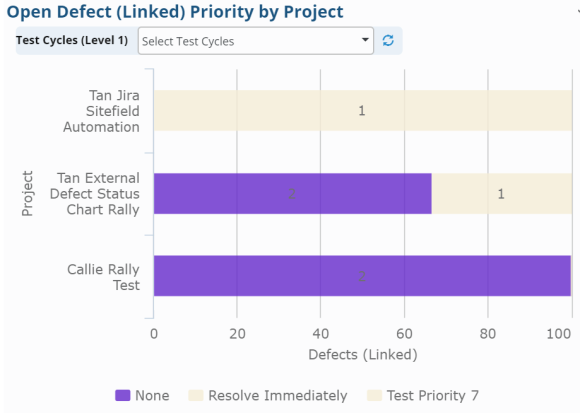
|
Presents the number of linked external defects grouped by priority in each project |