Coverage Dashboards
| qTest, Tosca, or both | Chart Name | What is This Chart, and Why Use it? | Chart image in Insights | Business Rules |
|---|---|---|---|---|
| qTest | Module Test Run Coverage | A chart that displays the amount of Defects per module within a given project |
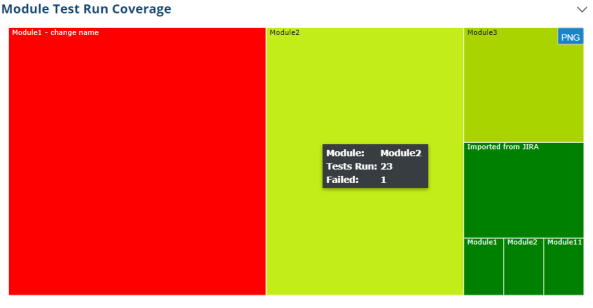
|
This heat map chart shows the combination data of Module Name, # of TR and # of Failed TR of that module. Box name: Module Name Box Width: Number of Test Run of that Module (directly). Box Color: vary from red to yellow base on Number of Failed TR Bigger boxes stay on left then the smaller ones |
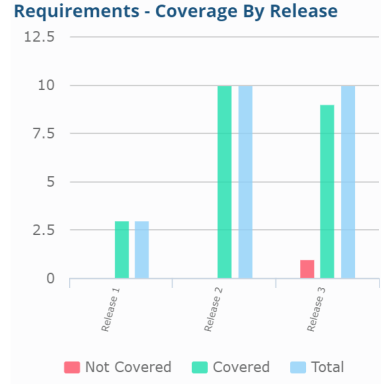
| qTest | Requirements - Coverage By Release (also in Requirements dashboard) |
A stacked bar graph that displays the amount of Covered and Not Covered Requirements. The graph also displays the total amount of Requirements per Release. |
|
Count requirements covered/not covered/total reqs by release.
|
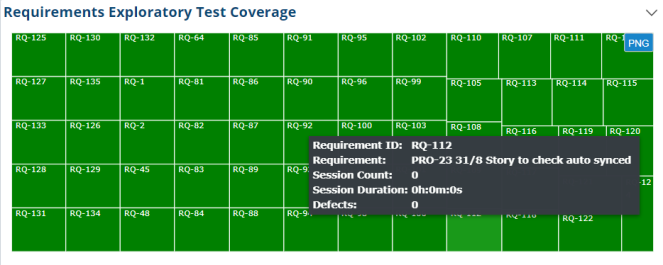
| qTest | Requirements Exploratory Test Coverage (also in Requirements and Sessions dashboards) |
A mosaic chart that displays Requirement ID, description, session count, session duration, and Defects. This chart is color-coded based on preset Defect count thresholds. |
|
|
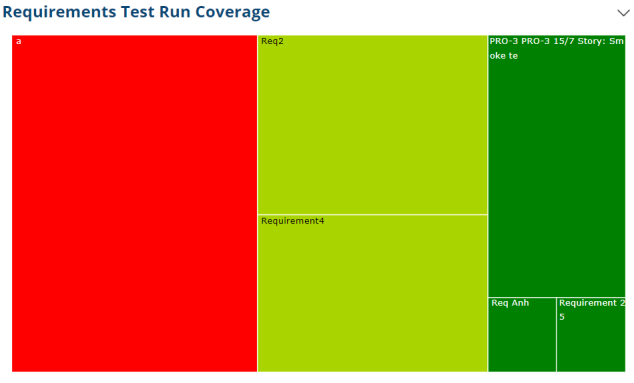
| Both | Requirements Test Run Coverage (also in Requirements dashboard) |
A mosaic chart that displays Requirement ID, total amount of Test Runs, and amount of failed Test Runs failed. The chart is color coded based on preset Test Runs failed vs executed thresholds |
|
This chart shows the amount and status of test runs that cover the requirements. 1 box is 1 requirement. Box size: number of associated test runs. Box color: more failed test runs --> darkest red, less failed --> lighter red to yellow, yellow green, green, darkest green |
| qTest | Screens Exploratory Test Coverage | A mosaic chart that displays Title, Session Count, Session Duration, and Defects present for certain screens. For example, a help page on a website or a Desktop toolbar. |