Automation Dashboards
| qTest, Tosca, or both | Chart Name | What is This Chart, and Why Use it? | Chart image in Insights | Business Rules |
|---|---|---|---|---|
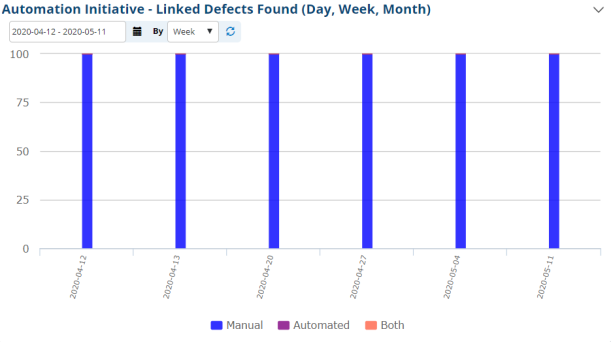
| qTest | Automation Initiative - Linked Defects Found (Day, Week, Month) | A stacked bar graph that shows the amount of found linked Defects that are either manual, automated, or both. This data can be tracked and displayed by either the day, week, or month. |
|
This chart is to count the percentage of linked defects dividing into manual and automation within the selected date range. X axis: Day/Start date of Week or Month Y axis: Percentage A defect is linked when externalIssueId and externalIssueStatus are not null. A defect in automated/manual is based on the automationId of the latest version of the date range. So, we need to get data from the test_case_aud Manual: automationId = 712 or Null Automation: automationId = 711 Note: The current Insights do not count Tosca issue (TestCase. automationId=713) |
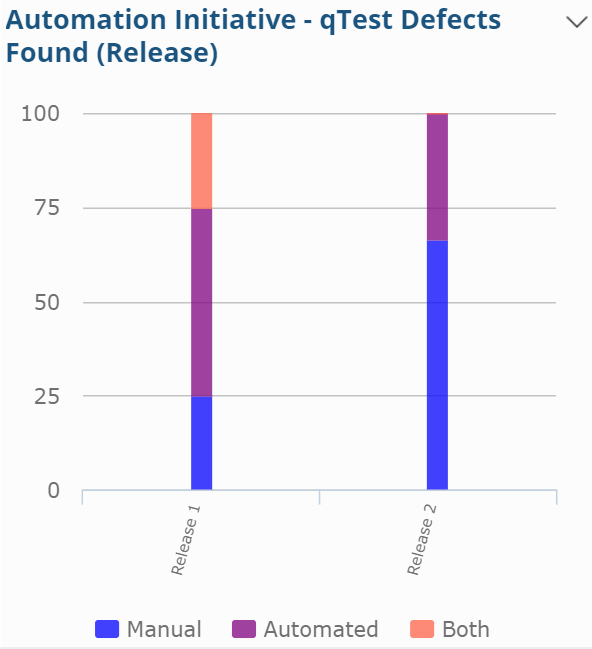
| qTest | Automation Initiative - Linked Defects Found (Release) | A stacked bar graph that shows the amount of found linked Defects that are either manual, automated, or both. This data is tracked by Release. |
|
This chart shows the percentage of defects found on automated Test Cases, manual Test Cases and both "manual & auto" Test Cases within each release. X axis: Release Y axis: Percentage |
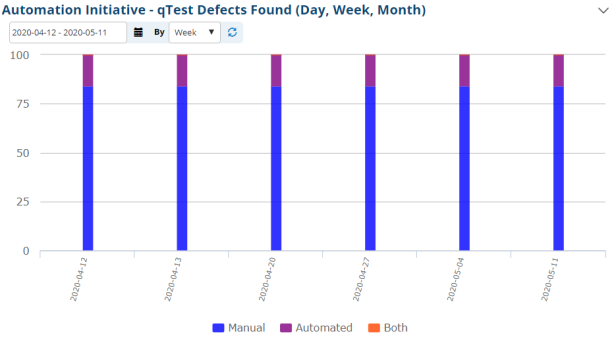
| qTest | Automation Initiative - qTest Defects Found (Day, Week, Month) | A stacked bar graph that shows the amount of found qTest Defects that are either manual, automated, or both. This data can be tracked and displayed by either the day, week, or month. |
|
This chart is to count percentages of manual qTest defects and automation qTest defects within the selected date range. X axis: Day/Start date of Week or Month. Y axis: Percentage A defect is automated/manual and based on the automationId of the latest version of the date range. Get data from the test_case_aud Manual: automationId = 712 or Null Automation: automationId = 711 In Insights, all of the defects belong to the run date: 2020/05/03, but if we choose the date ranges: [2020/05/01-2020/05/01], we get the same result. Note: The current Insights does not count Tosca issues (TestCase. automationId=713). |
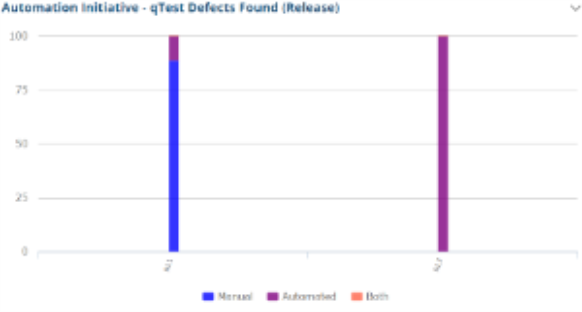
| qTest | Automation Initiative - qTest Defects Found (Release) | A stacked bar graph that shows the amount of found qTest Defects that are either manual, automated, or both. This data is tracked by Release. |
|
This chart is to count the percentage of manual and automation defects by defect affected release. X axis: Defect affected release Y axis: Percentage of automated and manual defects How to count a defect to manual/automation: view Automation Initiative - qTest Defects Found (Day, Week, Month) Note: The current Insights do not count Tosca issue (TestCase. automationId=713) |
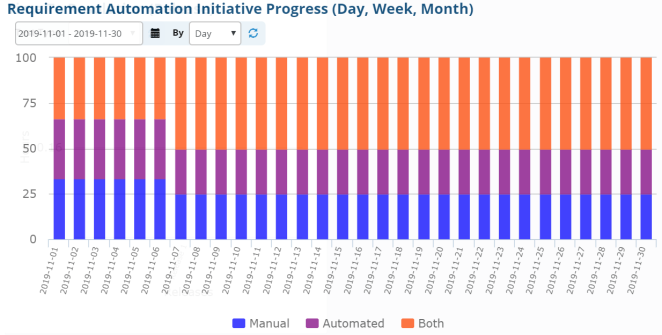
| qTest | Requirement Automation Initiative Progress (Day, Week, Month) (also in Requirements dashboard) |
A stacked bar graph that shows the amount of Requirements that are either manual, automated, or both. This data is tracked by either the day, week, or month. |
|
This chart shows the percentage of the requirements covered by manual, automated, or both types of Test Cases at the end of each day, week, or month X axis: Day/Start date of Week or Month Y axis: Percentage |
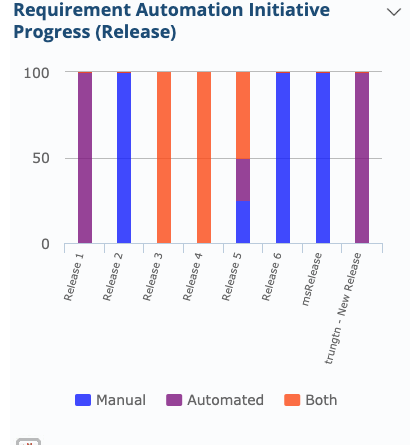
| qTest | Requirement Automation Initiative Progress (Release) (also in Requirements dashboard) |
A stacked bar graph that shows the amount of Requirements that are either manual, automated, or both. This data is tracked by Release. |
|
This chart shows the percentage of the requirements covered by manual, automated or both types of Test Cases within each release. X axis: Release Y axis: Percentage |
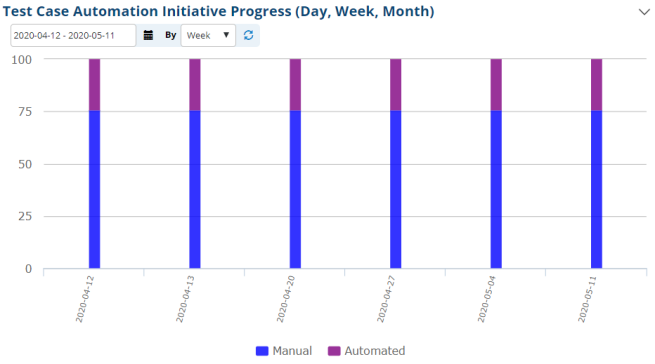
| qTest | Test Case Automation Initiative Progress (Day, Week, Month) (also in Test Case dashboard) |
A stacked bar graph that shows the amount of Test Cases that are either manual, automated, or both. This data is tracked by day, week, or month. |
|
This chart shows the correlation between the percentage of automated and manual Test Cases. Count of Test Cases is accumulative. |
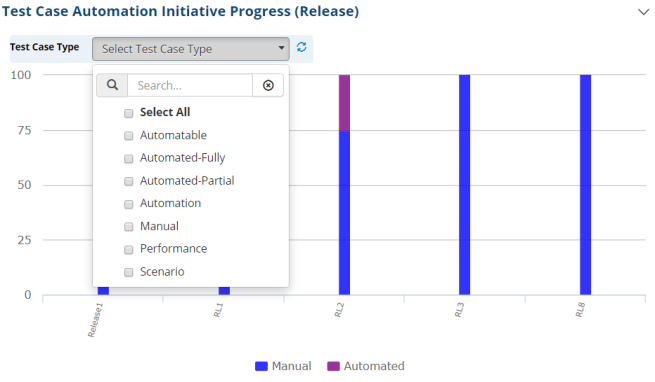
| qTest | Test Case Automation Initiative Progress (Release) (also in Test Case dashboard) |
A stacked bar graph that shows the amount of Test Cases that are either manual, automated, or both. This data is tracked by Release. |
|
X-axis: Releases Y-axis: Percentage of automated Test Cases and manual Test Cases |