Build custom dashboards
Dashboards give you a space to visually compare your testing data, so you can view and share easily digestible information. You can customize your panel groups and names, as well as organize them into tabs. This is great for reporting high-level data at regular intervals.
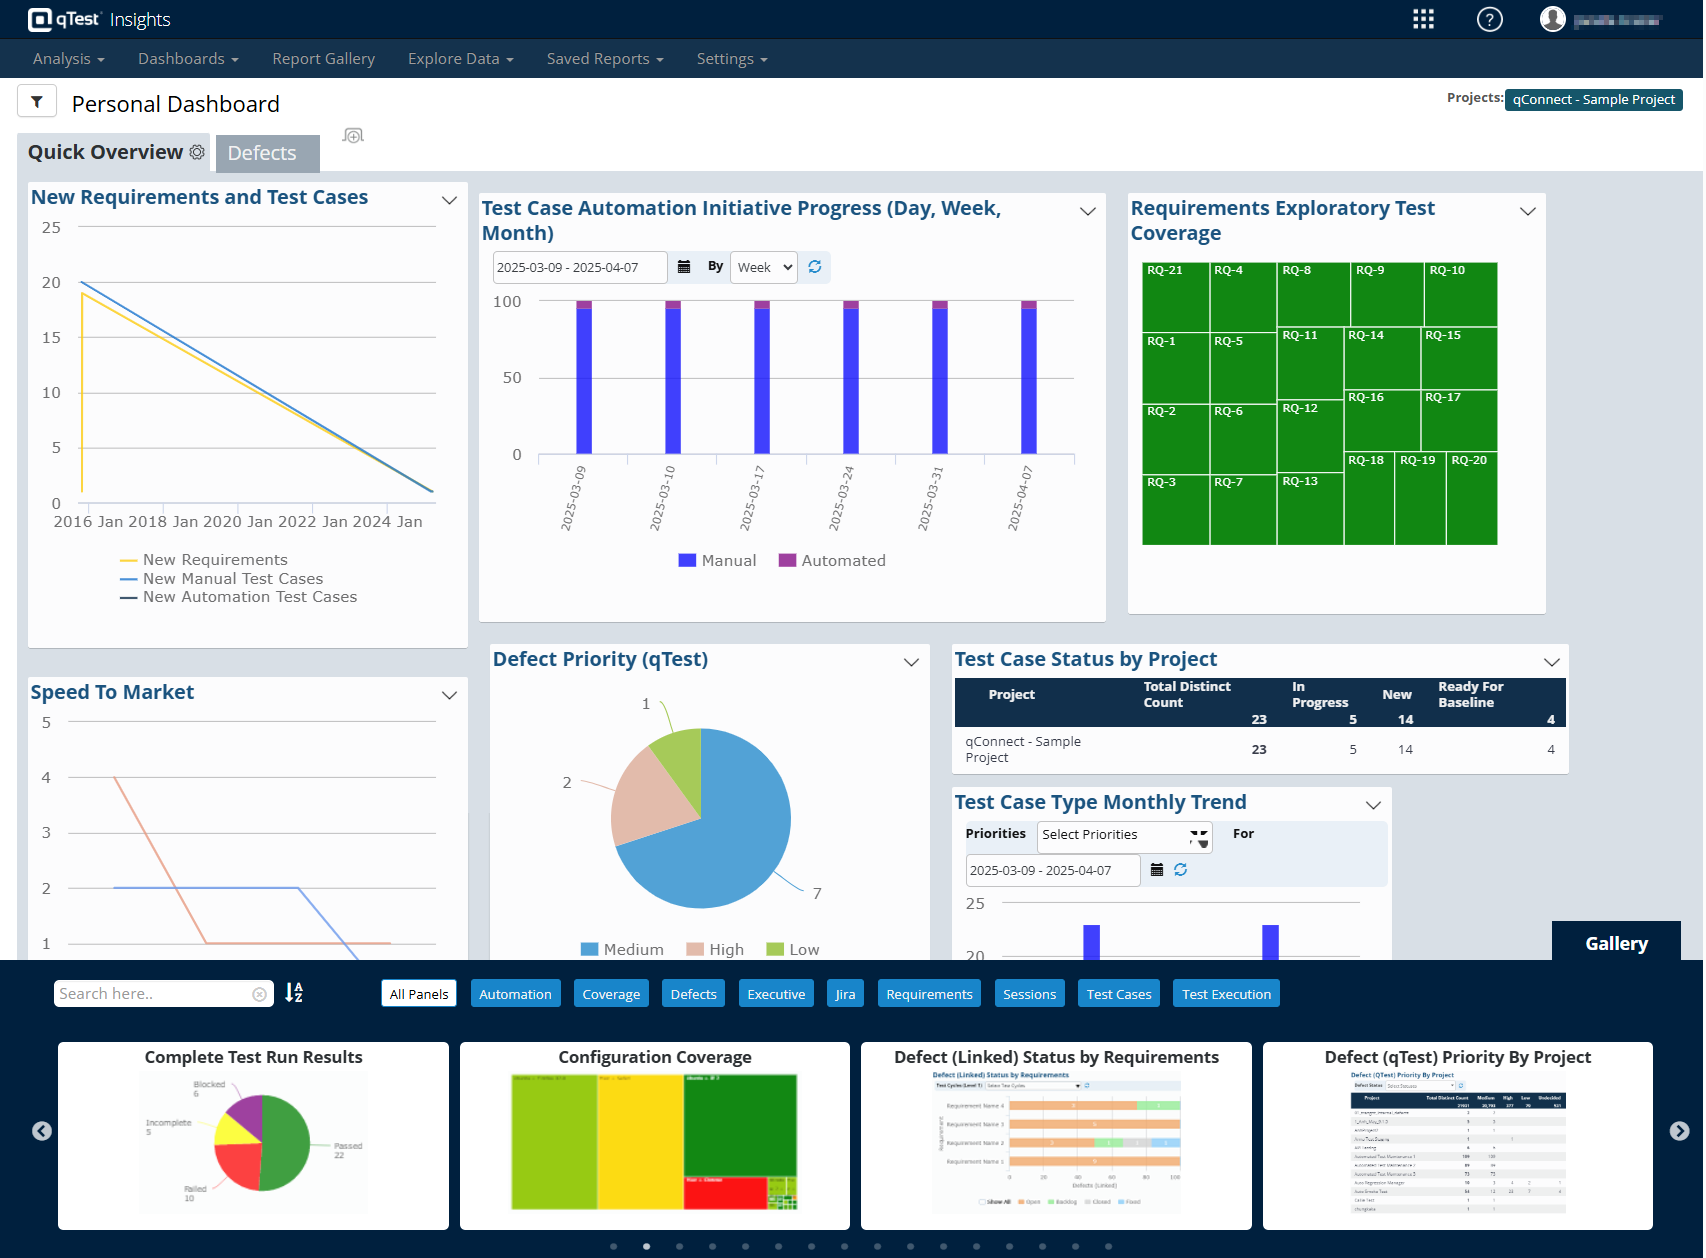
Use preset panels to create custom dashboards.
Before you start
Make sure you have the correct permissions:
-
To create, edit, or save filters for any dashboards, you need Insights Editor permissions.
-
To view the Shared dashboard, you need Insights View permissions.
Pre-defined dashboards
In addition to the prebuilt analysis dashboards, offers two pre-defined, editable dashboards:
-
Shared: This dashboard is a collaborative, shared space with other Insights users on your instance. All Administrators with Insights View permissions can view it, and Administrators with Insights Editor permissions can edit it.
-
Personal: This dashboard is your own space. Go wild!
Note that you can't rename or delete Shared and Personal dashboards.
Panels
qTest Insights offers a variety of panels that you can use to view datasets from many different areas in your testing process. Depending on your needs, drag and drop these panels from the Gallery to create unique dashboard views.
Check out the following topics to learn more:
Create a new dashboard
In addition to the prebuilt analysis dashboards and pre-defined personal and shared dashboards, you can create as many custom dashboards as you need.
To create a dashboard, follow these steps:
-
Go to the Dashboards tab and select Create Dashboard from the dropdown menu.
-
To give the new dashboard a unique name, select the Gear icon and then Rename from the dropdown menu. Enter your desired name in the text-field and select
 Save.
Save. -
Drag panels you want to add from the Gallery at the bottom of the dashboard to wherever you want them to display.
-
Optionally, select the
 New tab button to add tabs that organize your dashboard.
Insights automatically saves any changes you make to your dashboards. Note that other users with Insights Editor permission will be able to access and edit your newly created dashboard.
Filter a dashboard
Dashboards provide a powerful view across different parts of your testing process. Users with Insights Editor permissions can apply and save filters to create more specific dashboards. For example, you can create multiple versions of the same dashboard to cover different projects.
To create a filter, follow these steps:
-
Select the
 Global Filter icon to open the Filters panel.
 -
Narrow down your dashboard using the following values: Projects, Test Cycles, Modules, Release, and release Status. Any changes to your criteria affect the full dashboard view.
-
Set the filter to automatically refresh at intervals of 1, 2, 5, 10, or 20 minutes. You can also select Refresh Now at any point to reload your dashboard with the latest data.
-
Select Save as and give your filtered dashboard a name.
If you edit a the original version of a dashboard that's been saved with filters, such as by adding or removing panels, the changes also apply to the filtered versions of the dashboard.
Your browser keeps track of your Global Filter settings with cookies. To make sure these cookies don't affect other dashboard views, be sure to remove the global filters before you navigate away from a dashboard saved with filters.
To access your filtered dashboards, navigate to Manage in the Dashboards dropdown, and go to the Saved with Filters section. Unless you choose to share the filtered dashboard with other editors, only you can see the filtered version. If you are saving a filtered Analysis Dashboard, you can currently find them in the Manage Saved Reports page.
What's next
Want to share a saved dashboard? Take a look at how to share dashboards.