Requirements Dashboards
| qTest, Tosca, or both | Chart Name | What is This Chart, and Why Use it? | Chart image in Insights | Business Rules |
|---|---|---|---|---|
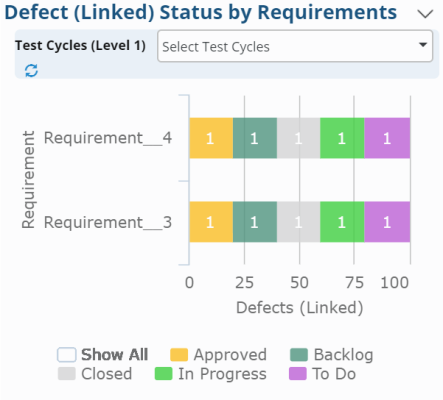
| qTest | Defect (Linked) Status By Requirements (also in Coverage dashboard) |
A chart that displays Linked Defect Statuses per Requirement |
|
Counts defects by associated requirements, break down is by defect status |
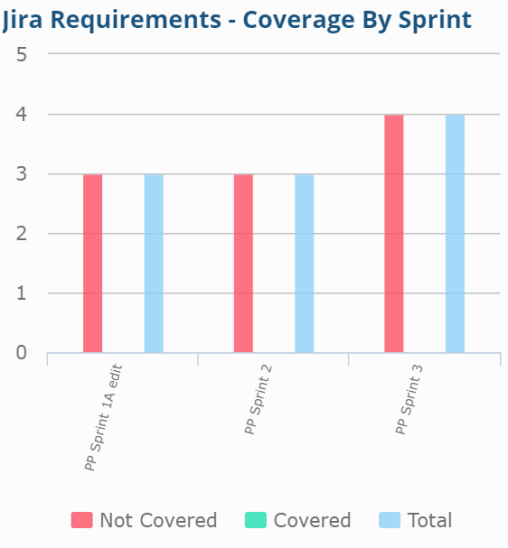
| qTest | Jira Requirements - Coverage By Sprint | A bar graph that tracks and displays the total amount of Jira Requirements, the amount of covered Jira Requirements, and the amount of Non-covered Jira Requirements--all per Sprint. |
|
Counts Jira requirements covered/not covered/total reqs by sprint.
|
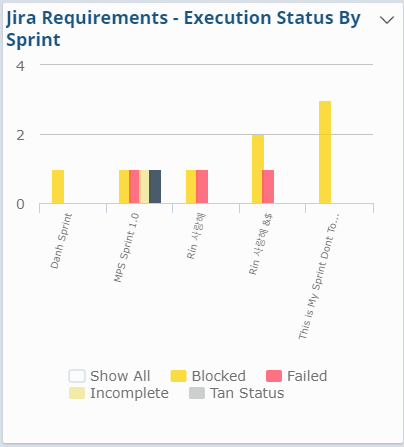
| qTest | Jira Requirements - Execution Status By Sprint | A bar chart that tracks and displays the amount of Jira Requirements with certain Execution Statuses per Sprint |
|
Counts requirements in every sprint, breakdown by its last run status (such as In a sprint, how many requirements whose last execution is Passed/ Failed/Blocked, etc.) |
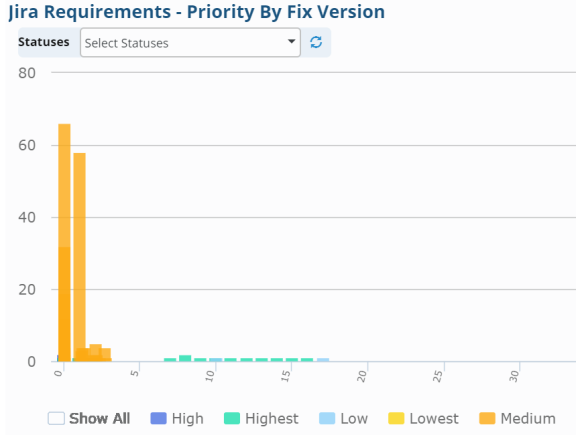
| qTest | Jira Requirements - Priority By Fix Version (also in Jira dashboard) |
A bar chart that displays the amount of Jira Requirements by both Priority and Fix version |
|
Counts Jira requirements by fix version, break down is by requirement priority |
| qTest | Jira Requirements - Priority By Sprint (also in Jira dashboard) |
A bar chart that displays the amount of Jira Requirements by both Priority and Sprint |
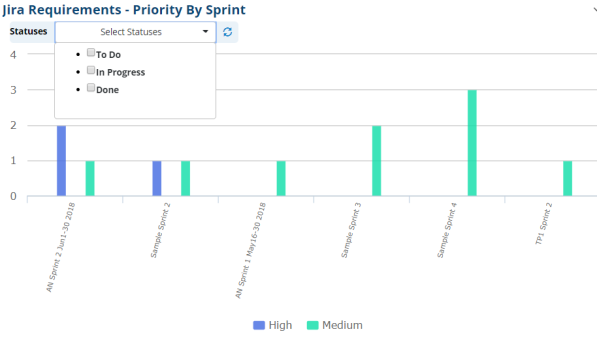
|
Counts Jira requirements by sprint, break down is by requirement priority |
| qTest | Jira Requirements - Severity By Fix Version (also in Jira dashboard) |
A bar chart that displays the amount of Jira Requirements by both Severity and Fix Version | ||
| qTest | Jira Requirements - Severity By Sprint (also in Jira dashboard) |
A bar chart that displays the amount of Jira Requirements by both Severity and Sprint | Presents the number of Jira requirements in each Sprint, grouped by severity | |
| qTest | New Requirements and Test Cases (also in Test Cases dashboard) |
A line graph that tracks and displays new Requirements, new manual Test Cases, and new automated Test Cases by month |
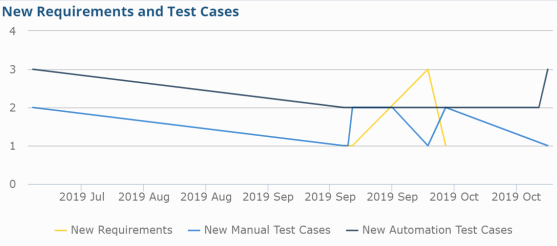
|
Shows the number of requirements, manual test cases, and automated test cases by day. For the test cases, the type (manual or automated) is the latest updated type. Only shows the point at the dates on which at least 1 requirement or test case is created. X axis: Date Y axis: Quantity of requirements or test cases |
| qTest | Requirement - Execution Status By Release (also in Test Execution dashboard) |
A stacked bar chart that tracks and displays the amount of Requirements with certain Execution Statuses by Release |
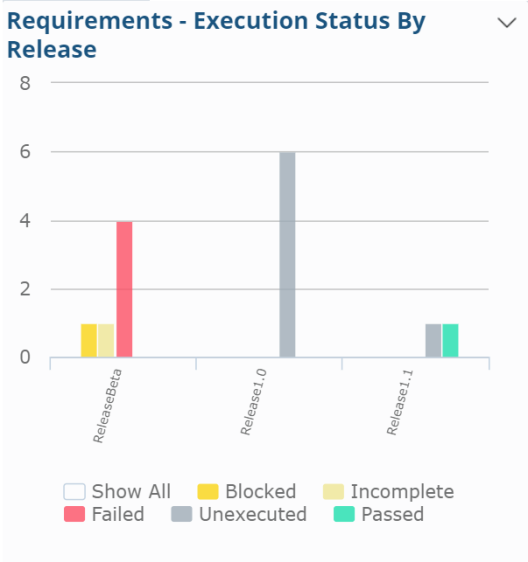
|
Counts requirements in every release, breakdown is by its last run status (such as In a release, how many requirements whose last execution is Passed/ Failed/Blocked, etc.) |
| qTest | Requirement Automation Initiative Progress (Day, Week, Month) (also in Automation dashboard) |
A stacked bar graph that shows the amount of Requirements that are either manual, automated, or both. This data is tracked by either the day, week, or month. |
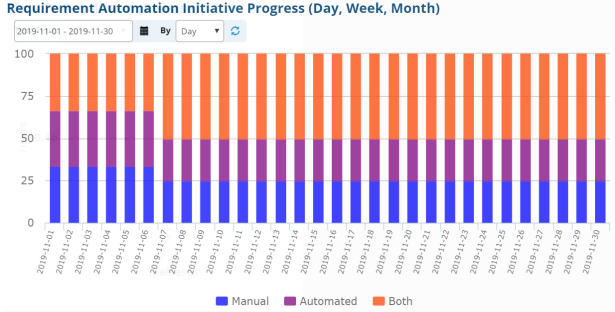
|
Shows the percentage of the requirements covered by manual, automated or both type of Test Cases at the end of each day, week, or month X axis: Day/Start date of Week or Month Y axis: % |
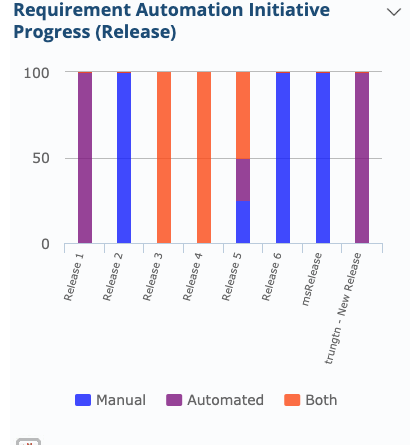
| qTest | Requirement Automation Initiative Progress (Release) (also in Automation dashboard) |
A stacked bar graph that shows the amount of Requirements that are either manual, automated, or both. This data is tracked by Release. |
|
Shows the percentage of the requirements covered by manual, automated or both types of Test Cases within each release. X axis: Release Y axis: % |
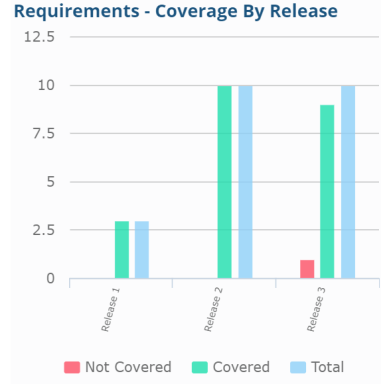
| qTest | Requirements - Coverage By Release (also in Coverage dashboard) |
A stacked bar graph that displays the amount of Covered and Not Covered Requirements. The graph also displays the total amount of Requirements per Release. |
|
Counts requirements covered/not covered/total reqs by release.
|
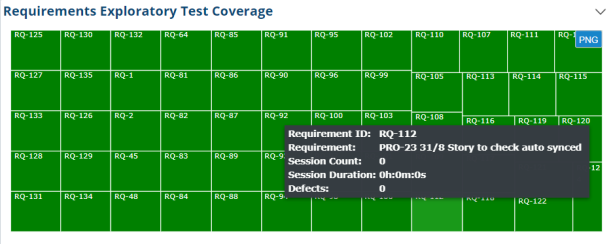
| qTest | Requirements Exploratory Test Coverage (also in Coverage and Sessions dashboards) |
A mosaic chart that displays Requirement ID, description, session count, session duration, and Defects. This chart is color-coded based on preset Defect count thresholds. |
|
|
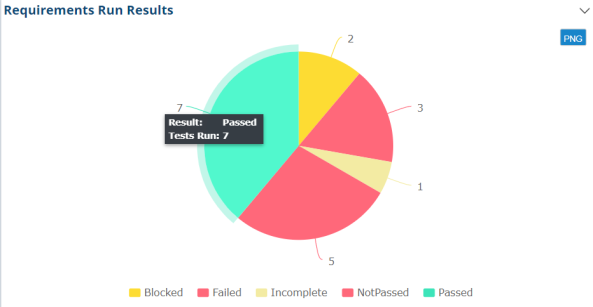
| Both | Requirements Run Results
(also in Test Execution dashboard) |
A pie chart that tracks and displays the amount of Test Run Requirements by Result |
|
Shows the number of Test Runs (belong to Test Cases which have linked with a requirement) grouped by latest result |
| Both | Requirements Test Run Coverage (also in Coverage dashboard) |
A mosaic chart that displays Requirement ID, total amount of Test Runs, and amount of failed Test Runs failed. The chart is color coded based on preset Test Runs failed vs executed thresholds |
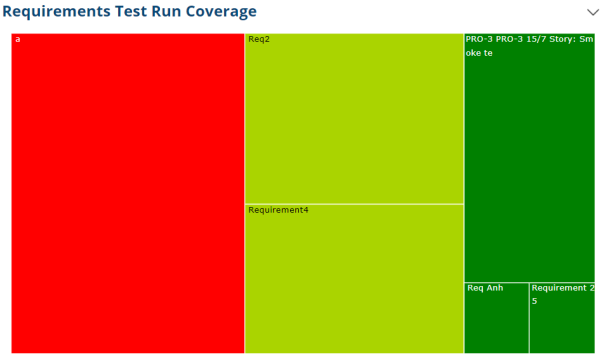
|
Shows the amount and status of Test Runs that cover the requirements. 1 box is 1 requirement. Box size: number of associated test runs. Box color: more failed test runs --> darkest red, less failed --> lighter red to yellow, yellow green, green, darkest green |