Executive Dashboards
| qTest, Tosca, or both | Chart Name | What is This Chart, and Why Use it? | Chart image in Insights | Business Rules |
|---|---|---|---|---|
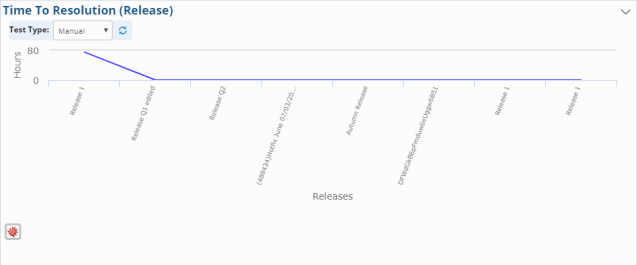
| qTest | Time To Resolution (Release) | A line graph that tracks total time to resolution per Release |
|
Summing up the length of time from the failed execution to the nearest passed execution within a release. The length of time is from the end time of the failed execution to the end time of the passed execution. In case there are many continuous failed execution results, the time will be count from the first failed result in the queue. Filter by the test type: Automation, Manual, or Both |
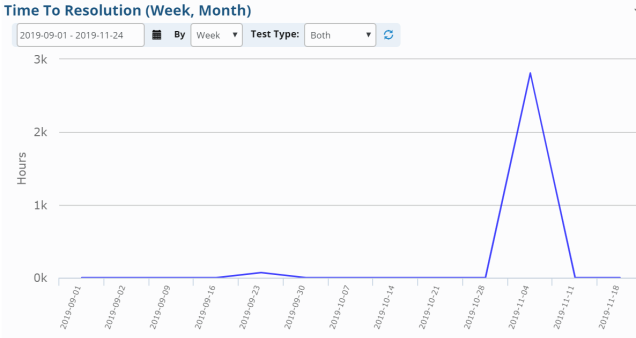
| qTest | Time To Resolution (Week, Month) | A line graph that tracks total time of resolution per week or month |
|
Summing up the length of time from a failed execution to the nearest passed execution within a week or a month. The length of time is from the end time of the failed execution to the end time of the passed execution.
|