Values tab
The Values tab allows sorting elements of a test quickly.
The Values tab is on the Test Result view which is accessible on the opening of a load Test Result. For more information, see Get more details about a test.
Note: The Values tab must be refreshed to display the latest activity received from NeoLoad.
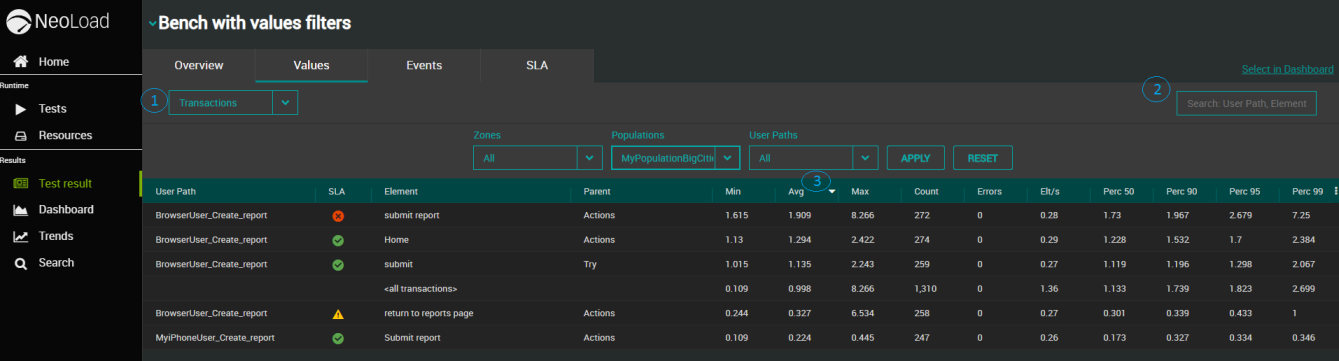
The Values tab contains the following components:
-
A link to see the selected Test Result in the Dashboards.
-
A drop-down menu to select an element type.
-
A table presenting the statistics computed for the element type selected.
-
A Filter field to refine the results and help you find what you search faster.
-
Filters to apply to the element type selected.
Find specific values
By default, the values displayed in the table are those of the Transactions.
To quickly find specific values, follow these steps:
-
Select the type of element you want to be displayed in the table: Transactions, Pages, Requests or Counters using the drop-down menu -

-
You can refine the results displayed in the table using the textual filter on the right of the view -

-
Sort the values in ascending or descending order by clicking the relevant column header -

Values types
Values are displayed for the following element types:
-
Transactions
-
Requests
-
Pages
-
Counters
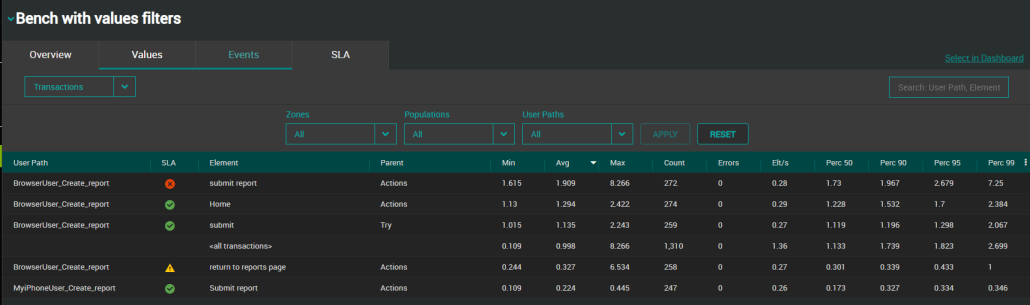
For each element type selected in the list box, the table displays performance values that are metrics meant to help a quick and accurate analysis of your Test Results.
Refer to the Transaction glossary entry for more information.
A Transaction performance value is composed of the information below:
-
User Path: The name of the User Path relating to the Transaction.
-
SLA: When an SLA is defined for the Transaction, it returns the SLA status defined in NeoLoad. The status can be "Success", "Failed", or "Warning". For more information about SLAs, see Service Level Agreement (SLA) profiles.
Tip: A click on an SLA status icon redirects you to the corresponding Element in the SLA tab. This provides you with the details of the SLA applied to the Element selected.
-
Element: The name of the Transaction.
-
Parent: The name of the element parent in the design tree. Providing this name helps quickly spot the Transaction defined in NeoLoad.
Note: The User Path, Element and Parent columns actually represent the unique identifiers of the Transaction allowing to clearly spot it in the NeoLoad design tree.
-
Min: Shortest response time, in seconds. NeoLoad response times are calculated from the time the first byte of a request is sent, until the time the last byte of the response is received, namely including network time to send request and receive response.
-
Avg: Average response time, in seconds. NeoLoad response times are calculated from the time the first byte of a request is sent, until the time the last byte of the response is received, namely including network time to send request and receive response.
-
Max: Longest response time, in seconds. NeoLoad response times are calculated from the time the first byte of a request is sent, until the time the last byte of the response is received, namely including network time to send request and receive response.
-
Count: Total number of full executions of Transactions. If a Transaction is interrupted (because of Virtual User's stop), then the count number is not incremented. Refer to the Count glossary entry for more information.
-
Errors: Total number of failed Transactions.
-
Elt/s: Number of iterations of the selected Transaction per second.
-
Perc 50: (Percentile 50) Indicates the highest response time for 50% of the Transaction executions. Example for the first line of the table below: 50% of the Transaction executions have a response time lower or equal to 0,027 seconds.
-
Perc 90: (Percentile 90) Indicates the highest response time for 90% of the Transaction executions.
-
Perc 95: (Percentile 95) Indicates the highest response time for 95% of the Transaction executions.
-
Perc 99: (Percentile 99) Indicates the highest response time for 99% of the Transaction executions.
Note: Percentiles can only be provided for tests performed with Controller 7.4 versions and above. Percentiles are displayed in the Dashboards reports for tests performed with NeoLoad Web 4.0 versions and above.
You can display additional statistics with the ![]() menu:
menu:
-
Min TTFB: Minimum Time To First Byte (TTFB).
-
Avg TTFB: Average Time To First Byte (TTFB).
-
Max TTFB: Maximum Time To First Byte (TTFB).
-
Error rate: Percentage of Transactions with errors out of the total number of Transactions.
Refer to the Web page glossary entry for more information.
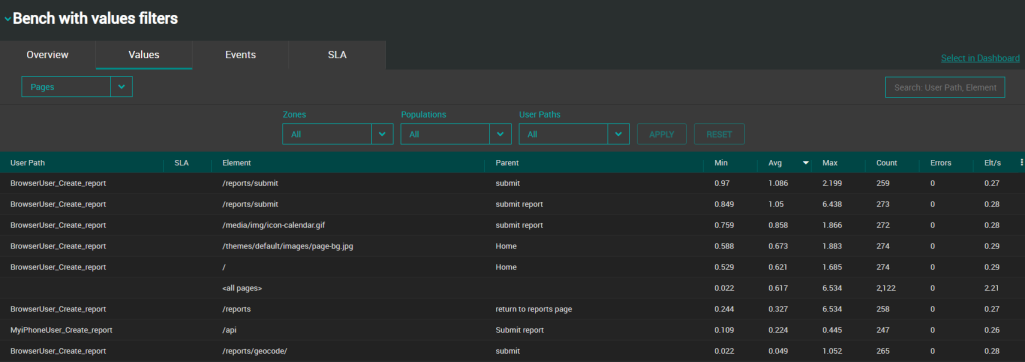
A Page performance value is composed of the information below:
-
User Path: The name of the User Path relating to the Page.
-
SLA: When an SLA is defined for the Page, it returns the SLA status defined in NeoLoad. The status can be "Success", "Failed", or "Warning".
For more information about SLAs, see Service Level Agreement (SLA) profiles.
Tip: A click on an SLA status icon redirects you to the corresponding Element in the SLA tab. This provides you with the details of the SLA applied to the Element selected.
-
Element: The path of the Page.
-
Parent: The name of the element parent in the NeoLoad design tree. Providing this name helps quickly spot the Page created in NeoLoad.
-
Min: Shortest response time, in seconds. NeoLoad response times are calculated from the time the first byte of a request is sent, until the time the last byte of the response is received, namely including network time to send request and receive response.
-
Avg: Average response time in seconds. NeoLoad response times are calculated from the time the first byte of a request is sent, until the time the last byte of the response is received, namely including network time to send request and receive response.
-
Max: Longest response time, in seconds. NeoLoad response times are calculated from the time the first byte of a request is sent, until the time the last byte of the response is received, namely including network time to send request and receive response.
-
Count: Total number of full executions of Pages. If a Page is interrupted (because of error or end of test), then the count number is not incremented. Refer to the Count glossary entry for more information.
-
Errors: Total number of failed Pages.
-
Elt/s: Number of iterations of the selected Page per second.
You can display additional statistics with the ![]() menu:
menu:
Refer to the HTTP request glossary entry for more information.
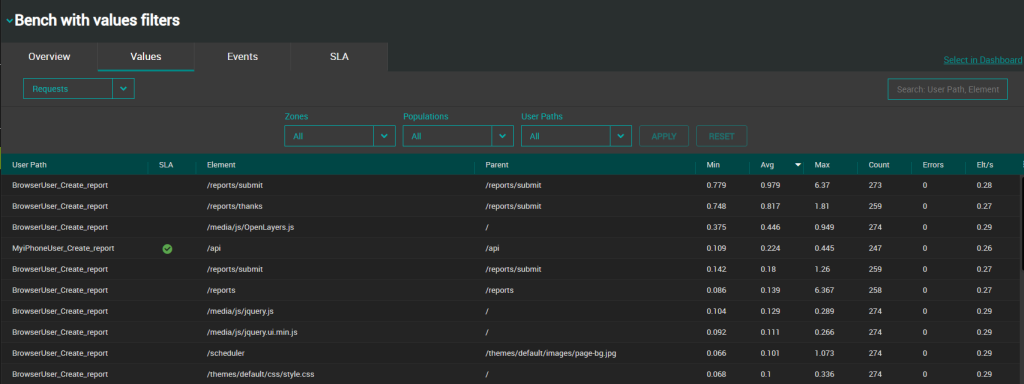
A Request value performance value is composed of the information below:
-
User Path: The name of the User Path relating to the request.
-
SLA: When an SLA is defined for the Request, it returns the SLA status defined in NeoLoad. The status can be "Success", "Failed", or "Warning". For more information about SLAs, see Service Level Agreement (SLA) profiles.
Tip: A click on an SLA status icon redirects you to the corresponding Element in the SLA tab. This provides you with the details of the SLA applied to the Element selected.
-
Element: Depending on the request type, the column displays the name or path of the request.
-
Parent: The name of the element parent in the NeoLoad design tree. Providing this name helps quickly spot the request created in NeoLoad.
-
Min: Shortest response time, in seconds. NeoLoad response times are calculated from the time the first byte of a request is sent, until the time the last byte of the response is received, namely including network time to send request and receive response.
-
Avg: Average response time, in seconds. NeoLoad response times are calculated from the time the first byte of a request is sent, until the time the last byte of the response is received, namely including network time to send request and receive response.
-
Max: Longest response time, in seconds. NeoLoad response times are calculated from the time the first byte of a request is sent, until the time the last byte of the response is received, namely including network time to send request and receive response.
-
Count: Total number of full executions of requests. If a request is interrupted (because of error or end of test), then the count number is not incremented. Refer to the Count glossary entry for more information.
-
Errors: Total number of failed requests.
-
Elt/s: Number of iterations of the selected element per second.
You can display additional statistics with the ![]() menu:
menu:
Refer to the Performance counter glossary entry for more information.
A Counter performance value is composed of the information below:
-
Name: The unique identifier of the Counter.
-
Min: Shortest value recorded on the Monitor, in seconds.
-
Avg: Average value, in seconds.
-
Max: Longest value, in seconds.
Filter by Zone, Population and User Path
The filter list boxes available for Transactions, Requests and Pages allow filtering values.
Caution: : Filters can only be applied for tests run with a 7.4.0+ Controller.

Filters can be combined together. A click on Apply validates the filter. A click on Reset sets the filters back to All.
This helps refine a test analysis and focus on unexpected values for a specific context (Zone, User path, Population).