User Paths
All elements of a User Path (web pages, HTTP requests, Transactions, etc.) can be plotted in graphs in the Dashboards view of NeoLoad Web.
NeoLoad Web allows you to trace line graphs, where elapsed time is displayed on the (horizontal) X-axis and the statistic values are plotted on the (vertical) Y-axis.
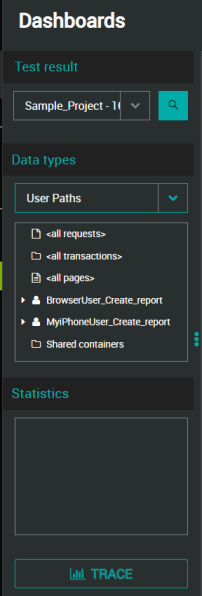
Information on the User Paths tree structure
-
<all requests> can be used for an average of all requests (for one User Path or for all User Paths)
-
<all transactions> can be used for an average of all Transactions (for one User Path or for all User Paths)
-
<all pages> can be used for an average of all pages (for one User Path or for all User Paths).
-
If the selected node is a child of the Shared containers node, the plotted statistics represent the aggregated statistics for all the User Paths that contain that element.
Available statistics
-
Average duration: Average response time
-
Maximum duration: Maximum response time
-
Minimum duration: Minimum response time
-
Elements/s: Number of elements per second
-
Throughput: Number of megabytes received from server
-
Average TTFB: Average time to first byte
-
Maximum TTFB: Maximum time to first byte
-
Minimum TTFB: Minimum time to first byte
-
Errors: Number of elements flagged as errors
-
Errors/s: Number of elements flagged as errors per second
-
Error rate: Number of elements flagged as errors out of the total number of executions
For more details about how to work with customized graphs, see Customized reports.