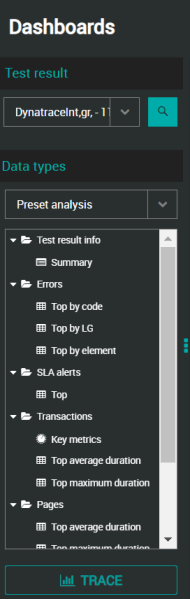
Preset analysis
The Preset analysis option enables you to display the key statistics of a Test Result.
-
Test Result info >Summary node: displays standard details of the test: project and scenario name, Test Result name, start and end date of the Test Result, test duration, test status.
-
Errors node: displays error statistics as data tables.
-
Top by code: The list of the 10 most frequent error codes on the Test Result. For every type of error, it lists the error code, the error description label and the number of errors.
For more information about NeoLoad error codes (beginning with NL-), see NeoLoad status codes. For more information about HTTP response codes, see HTTP status codes. -
Top by LG: The list of the 10 most frequent errors occurred in the Load Generator(s) specified
-
Top by Element: The number of errors occurred in the User Path related to the Transaction, the Element (i.e. the name of the Transaction), and the name of the element parent in the design tree.
-
-
SLA alerts node: displays SLA alerts statistics as data tables.
-
Top: The list of the 10 top SLA alerts on the Test Result.
-
-
Transactions node: displays Transaction statistics as data tables.
-
Key metrics: Average duration of Transactions in seconds, total number of Transactions per second, total number of Transactions passed and total number of Transactions failed on the Test Result.
-
Top average duration: The 10 Transactions that have the highest average execution duration
-
Top maximum duration: The 10 Transactions that have the highest maximum execution duration
-
-
Pages node: displays Page statistics as data tables.
-
Top average duration: The 10 Pages that have the highest average execution duration
-
Top maximum duration: The 10 Pages that have the highest maximum execution duration
-
-
Requests node: displays Request statistics as data tables.
-
Key metrics: Average duration of Requests in seconds, total number of Transactions per second, total number of Transactions passed and total number of Transactions failed on the Test Result.
-
Top average duration: The 10 Requests that have the highest average execution duration
-
Top maximum duration: The 10 Requests that have the highest maximum execution duration
-
For more details about how to work with graphs, see My graphs.