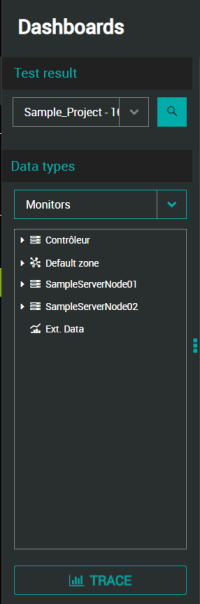
Monitors
The performance counters defined in NeoLoad Controller can be plotted in graphs in the Dashboards view of NeoLoad Web.
NeoLoad Web allows you to trace line graphs, where elapsed time is displayed on the (horizontal) X-axis and the monitor values are plotted on the (vertical) Y-axis.
-
Controller node: it is the NeoLoad controller executing the test
-
Performance counters
-
-
Zone node: node for each zone used
-
User load
-
Population node: node for each population used
-
User load
-
User Path
-
* User load
-
Load Generator
-
Performance counter
-
Performance counter category
-
* Performance counter
-
-
Monitored machine node
-
Monitor
-
Performance counter category
-
* Performance counter
-
For more details about how to work with graphs, see My graphs.