Export graphs and data tables
You can export graphs as PNGs, and you can export data tables as CSV files.
Export graph as PNG
You can download a graph as a .png file. For a better experience, it is recommended to maximize the graph before exporting it.
To export a graph as PNG, follow these steps:
-
Select a Workspace as described in Workspace selector.
-
In the left navigation panel, select the Dashboards view.
The table lists the Dashboards in your Workspace.
-
Locate the Dashboard containing the graph that you want to export and select it by clicking on its name in green.
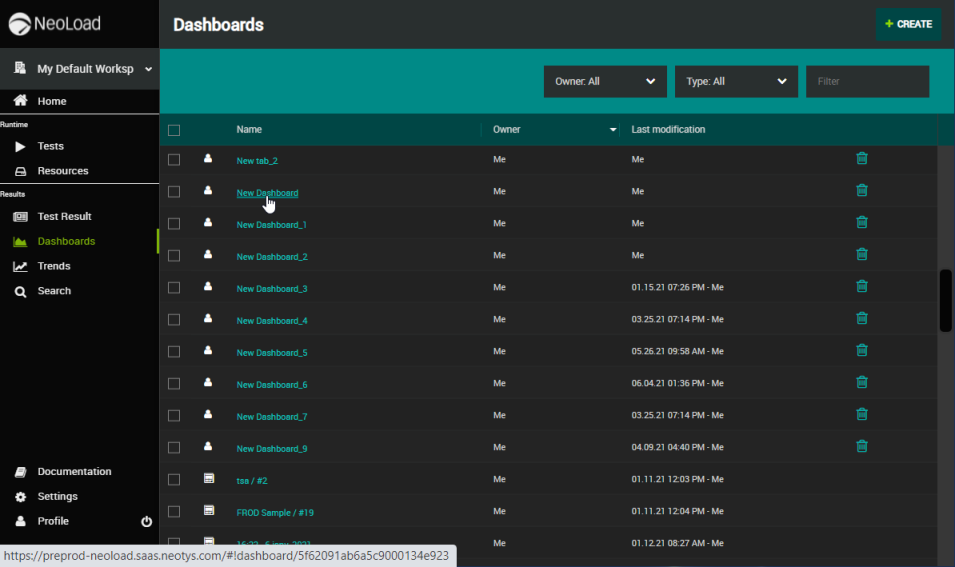
The view changes to display the selected Dashboard.
-
Maximize the graph, see Maximize/minimize a graph for more information.
-
In the header of the panel containing the graph, click the Export this panel as a PNG file button.
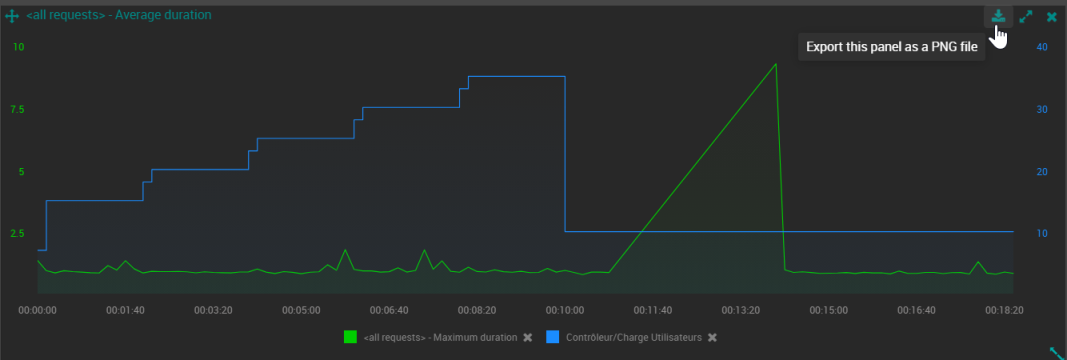
The graph is downloaded to your local machine.
Export data tables as CSV
To build reports and share them easily with people who don't have a NeoLoad Account, you can download a data table as a .csv file.
To export a data table as CSV, follow these steps:
-
Select a Workspace as described in Workspace selector.
-
In the left navigation panel, select the Dashboards view.
The table lists the Dashboards in your Workspace.
-
Locate the Dashboard where you want to export a data table and select it by clicking on its name in green.
The view changes to display the selected Dashboard.
-
In the header of the panel containing the table, click the Export this panel as a CSV file button.
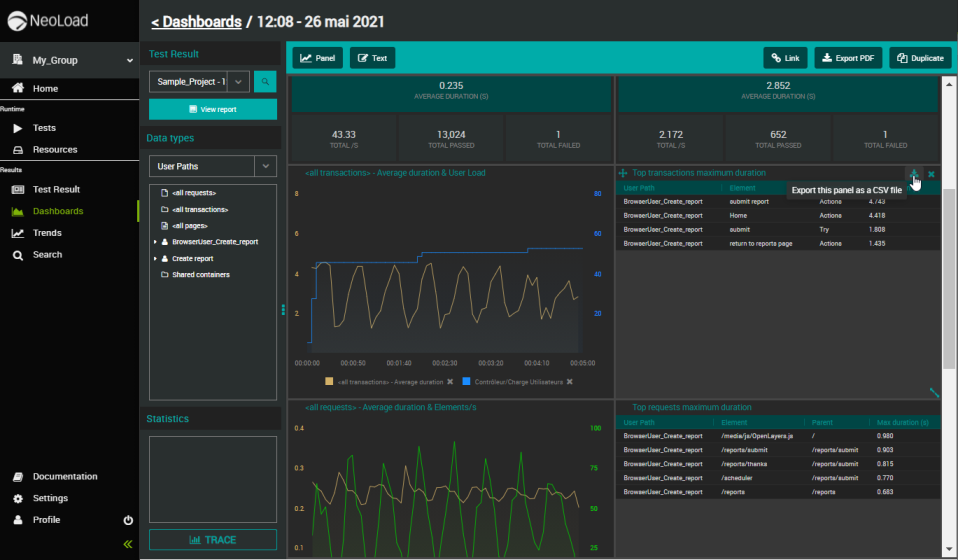
The table is downloaded to your local machine.