Indicators panel
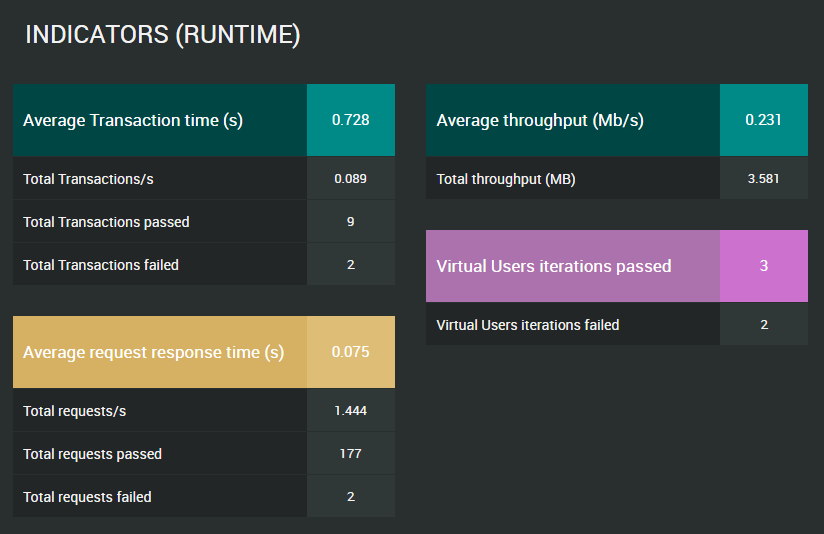
The Overview tab of the Test Result view displays statistics about the selected performance test in the INDICATORS panel.
During runtime, values are updated every 2 seconds.
Note: All these statistics are computed since the start of the test.
| Name | Description |
|---|---|
|
Average Transaction time (s) |
This is the average time in seconds for all Transactions of the scenario to be executed. |
|
Total Transactions/s |
This is the total number of the scenario's Transactions executed per second. |
|
Total Transactions passed |
This is the total number of the scenario's Transactions executed without encountering any error. |
|
Total Transactions failed |
This is the total number of the scenario's Transactions executed with errors. |
|
Average request response time (s) |
This is the average time in seconds for all requests of the scenario to be performed (from first byte sent to last byte received). |
|
Total requests/s |
This is the total number of requests in the scenario that are performed per second. |
|
Total requests passed |
This is the total number of requests in the scenario that did not encounter any error. |
|
Total requests failed |
This is the total number of requests in the scenario that encountered errors. |
|
Average throughput (Mb/s) |
This is the average size of http traffic received in megabits per second. |
|
Total throughput (MB) |
This is the total size of http traffic received in megabytes. |
|
Virtual User iterations passed |
This is the total number of times when the "Actions" Container was run for each Virtual User without encountering any error. |
|
Virtual User iterations failed |
This is the total number of times when the "Actions" Container was run for each Virtual User and encountered an error. |