Home view
The Home view provides a real-time, high-level view of running and finished load tests.
To access it, click ![]() in the left navigation panel.
in the left navigation panel.
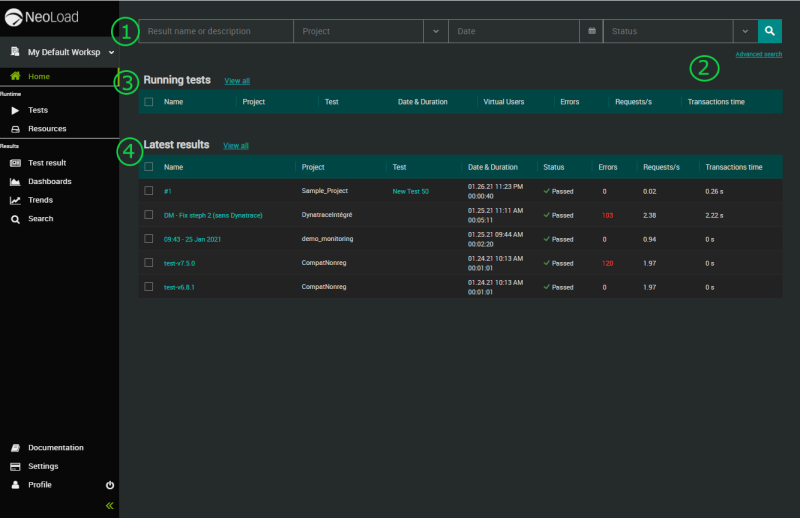
The Home view contains the following components:
 A Search bar on top of the view to perform a quick search
 A link to perform an advanced search
 A Running tests panel containing up to 5 rows.
They are the 5 most recent Test Results currently in progress ordered in reverse chronological order based on the test start date.
 A Latest results panel containing up to 5 rows.
They are the 5 most recent finished Test Results ordered in reverse chronological order based on the test start date.
Running tests
The Running tests panel contains the tests that are currently in progress.
By default, Test Results are ordered in reverse chronological order based on the test start date.
The list is automatically updated:
-
As soon as a test starts, it is added to the Running tests panel.
-
As soon as a test ends, it disappears from the Running tests panel and it is added to the Latest tests panel.
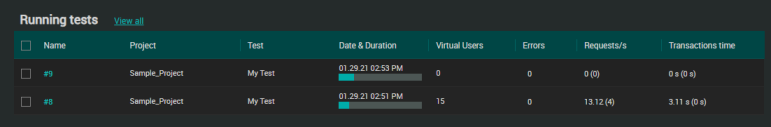
For each Test Result of the Running tests panel, the following information is provided:
-
Name: Name of the Test Result as defined in the Result name field of the Run a test dialog box. For more information, see Tests.
-
Project: Name of the project.
-
Test: Name of the test as configured in Tests. This is the name of the test configuration and not the name of the Test Result.
-
Date & Duration: Start date of the test, progress bar and percentage indicating elapsed time.
-
Virtual Users: Actual number of Virtual Users being executed during the test.
-
Errors: Total number of errors reported since test started (HTTP and NeoLoad status errors).
-
Requests/s: Average number of requests per second since test started (the figure in brackets refers to the current number).
-
Transactions time: Average response time in seconds for Transactions since test started (the figure in brackets refers to the current response time).
If you notice this icon ![]() on a Test Result row, it means that the test is managed in qTest and the icon enables you to access the test on the external tool.
on a Test Result row, it means that the test is managed in qTest and the icon enables you to access the test on the external tool.
For more details about what you can do with Test Results, see Test Results.
Latest tests
The Latest tests panel contains the tests that were executed and have ended.
By default, Test Results are ordered in reverse chronological order based on the test start date.
The list is automatically updated:
-
As soon as a test ends, it disappears from the Running tests panel and it is added to the Latest tests panel.
-
As soon as a test is removed, it disappears from the Latest tests panel.
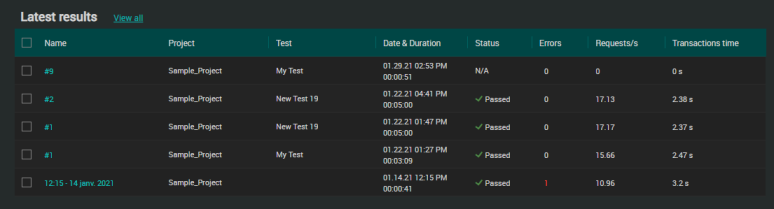
For each Test Result of the Latest tests panel, the following information is provided:
-
Name: Name of the Test Result as defined in the Result name field of the Run a test dialog box. For more information, see Tests.
-
Project: Name of the NeoLoad project containing the test.
-
Test: Name of the test as configured in Tests. This is the name of the test configuration and not the name of the Test Result.
-
Date & Duration: Start date of the test and elapsed time in HH:MM:SS.
-
Status: Status of the test. It can be:
-
"Passed": All SLA criteria have been met > status is deemed ok.
-
"Failed": At least 1 SLA criteria has been missed > status is deemed failed.
-
"N/A": The outcome of the test is deemed non applicable. It may also be unknown because it was started before version NeoLoad Controller 6.1 when Passed/Failed status did not exist.
-
-
Errors: Total number of errors reported since test started (HTTP and NeoLoad status errors).
-
Requests/s: Average number of requests per second since test started.
-
Transactions time: Average response time in seconds for Transactions since test started.
If you notice this icon ![]() on a Test Result row, it means that the test is managed in qTest and the icon enables you to access the test on the external tool.
on a Test Result row, it means that the test is managed in qTest and the icon enables you to access the test on the external tool.
For more details about what you can do with Test Results, see Test Results.
Tip: A click on a test status icon redirects you to the SLA tab where you can view and analyze the results of the SLA applied to the test. For more information, see SLA tab.