Analyze Transactions metrics
As a reminder, a Transaction groups the different web pages that make up a "business transaction".
In other words, a Transaction is a set of web pages that carry out a business exchange. A typical example is the set of pages used to connect to an application. Transactions are clearly marked in the Test Results to make analyzing download times easier."
The Transactions section in the Trends view displays the transactions metrics for the project and scenario selected in the Project and Scenario list boxes.
The Transactions section displays the trends related to the transactions metrics generated by the selected project.
Note: The Test Results are displayed in chronological order.
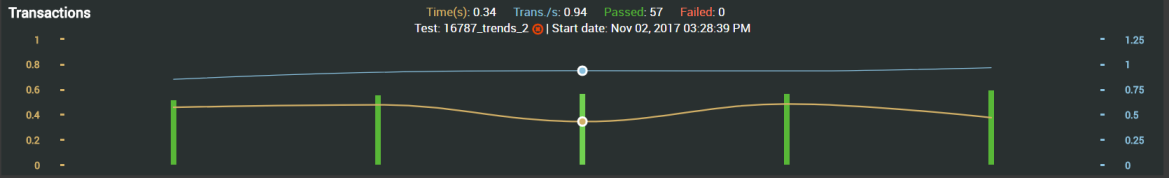
For each Test Result, the transactions metrics are represented as follows:
-
A vertical green/red bar representing the number of transactions passed and/or failed.
-
A yellow dot standing for the transaction average duration.
-
A blue dot standing for the average number of transactions per second.
As you move the mouse pointer over a bar, the Transactions, Requests, Throughputs and Virtual Users Iterations metrics for the selected Test Result are displayed in the corresponding sections. Below is an illustration for Transactions metrics.

The test name and status and the date when the test was launched are displayed below the metrics.
A click on a transactions metrics representation redirects you to the Test Result view. The Test Result view gives you valuable and accurate information about the selected Test Result. The Indicators zone in the Test Result view are those used in the Trends view.
For more information about the Test Result view, see Test Result view and Test Results.
![]()
The Transactions zone makes it possible to view and analyze the following metrics:
-
Time: This is the transactions average duration in seconds. A click on the Time item displays/hides the trend curve (brown) on the graph.
The graph displays the trends for all the test results of the project. -
Trans./s: This is the average number of transactions per second. A click on the Trans./s item displays/hides the trend curve (blue) on the graph.
The graph displays the trends for all the test results of the project. -
Passed: A click on the Passed item displays/hides all the transactions successfully executed.
-
Failed: A click on the Failed item displays/hides all the transactions that encountered an error during the test.
Tip: For more details about transactions success or failure in a test result, you can click on the corresponding test result
and have more details in the Test result view as described in Test result view.