Analyze Throughputs metrics
The Throughputs section in the Trends view displays information about the amount of data transferred during the tests execution.
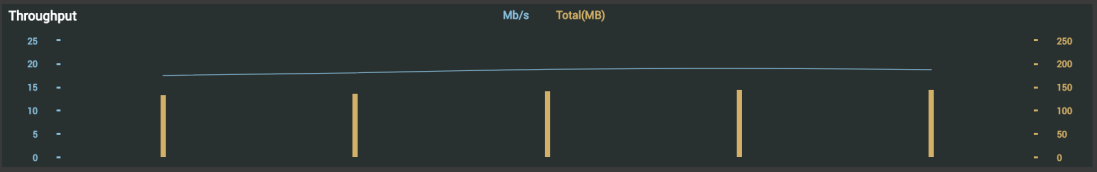
For each test, the throughputs metrics are illustrated as follows:
-
A vertical yellow bar representing the total amount of data generated by the related test.
-
A blue dot standing for the throughput per second.
As you move the mouse pointer over a bar, the Transactions, Requests, Throughputs and Virtual Users Iterations metrics for the selected Test Result are displayed in the corresponding sections. Below is an illustration for Throughput metrics.

Tip: The test name and status and the date when the test was launched are displayed below the metrics.
A click on a throughput metrics representation redirects you to the Test Result view. The Test Result view gives you valuable and accurate information about the selected Test Result. The Indicators zone in the Test Result view are those used in the Trends view.
For more information about the Test Result view, see Test Result view and Test Results.

The Throughputs zone makes it possible to view and analyze the following metrics:
-
Mb/s: This is the throughput per second expressed in megabytes. A click on the Mb/s item displays/hides the trend curve (blue) on the graph.
The graph displays the trends for all the test associated with the project and its associated scenario. -
Total(MB): This is the total amount of data generated by the tests. A click on the Total(MB) item displays/hides the trend bars (brown) on the graph.