Work with graphs
Graphs can be used in the same way as for the Runtime and Results views. For more information, see Work with graphs.
Graph features
The graphs features are the same as those for the Runtime and Results views. For more information, see Graph features.
Change the history mode
By default, runtime graphs display the full history of the test.
It is possible to switch from the full history mode to a shorter history mode displaying only a subset of data on a sliding window of the X last minutes configured in Edit > Preferences > Graphs > Runtime Graphs (by default 10 minutes).
To switch from the full history mode to the shorter history mode, follow these steps:
-
Select the graph you want to modify.
-
Click
 on the vertical toolbar or right-click the graph and choose Show last X min history.
To revert to the former mode, click
again or right-click the graph and choose Show full history.
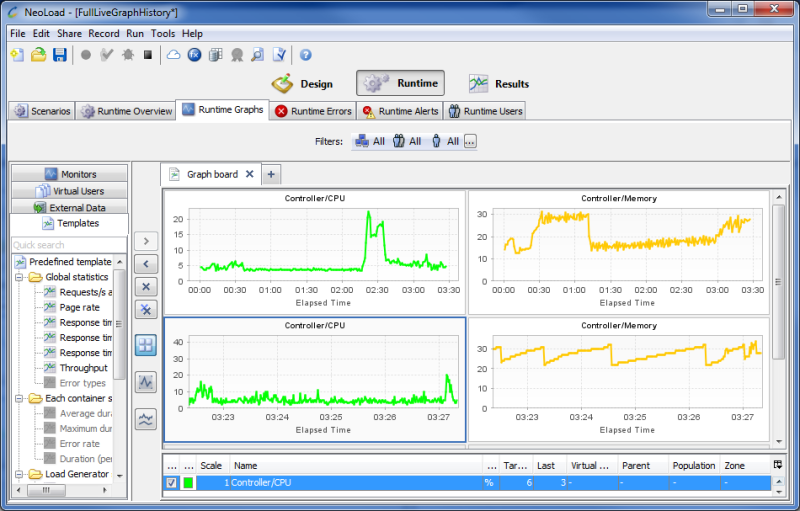
The screenshot above shows 4 graphs to monitor Controller/CPU and Controller/Memory.
The top graphs display the monitoring in full history mode while the bottom graphs display the monitoring over a sliding window set to the last 5 minutes.
Restore default graphs
Use the Restore button in the toolbar to delete all the current graphs and restore the default graphs.