Scenario advanced settings
The following settings can be edited for each scenario:
-
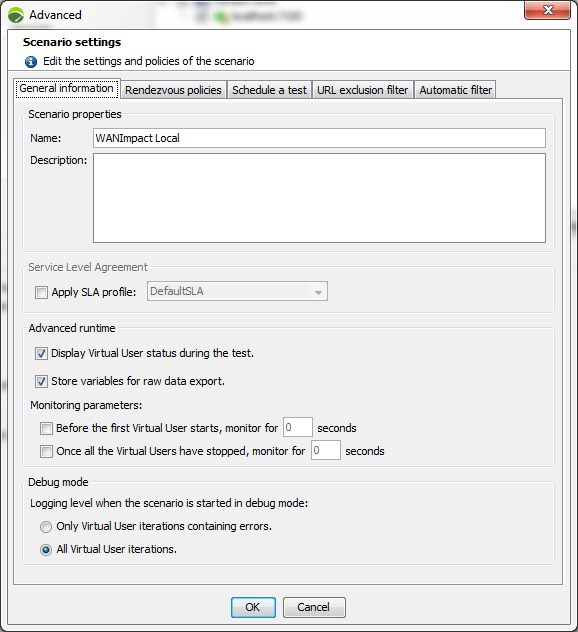
Scenario properties: name and description of the scenario.
-
Service Level Agreement: links an SLA profile to the selected scenario. For more information, see Link a scenario to a Service Level Agreement profile.
-
Advanced runtime:
-
Virtual users: enable or disable the real-time display of Virtual Users.
-
Store variables for raw data export: By default, variables are stored for raw data export. Unticking the check box results in not storing the variables for raw data export.
-
-
Monitoring parameters: enable a monitoring period before and/or after the test. This allows you to check the stressed server behavior prior to running the test and the load test impact upon it.
-
Debug mode: This mode records all the requests and responses executed for all the Virtual User iterations. For more information, see Start the test.
There are two logging levels:
-
Only Virtual User iterations containing errors
Errors in a Virtual User iteration may be caused by that user initialization, in other words during the execution of its Init Container. Consequently, a trace is always kept of the Init and End Containers executions for each Virtual User that returns an error. For example, if a Virtual User runs an iteration without any errors, then runs a second iteration that contains errors, the debug information is made available both for the second iteration of the Actions Container (Actions#2) and for the Init and End Containers.
-
All Virtual User iterations
Launching a scenario in debug mode can severely hamper performance, especially when too many Virtual Users are started on a single Load Generator.
To carry out a large-scale test, it is recommended to use several Load Generators with lighter loads.
-
Details of the Virtual Users runs are available in the test results in the Details tab. For more information, see Details
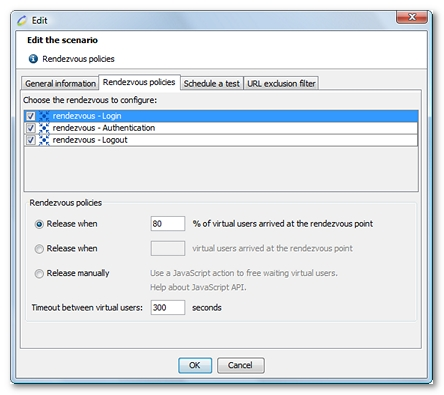
Rendezvous policies
For more information about configuring rendezvous policies, see Configure a Rendezvous scenario.
Schedule a test
NeoLoad allows you to schedule a test at a specified time.
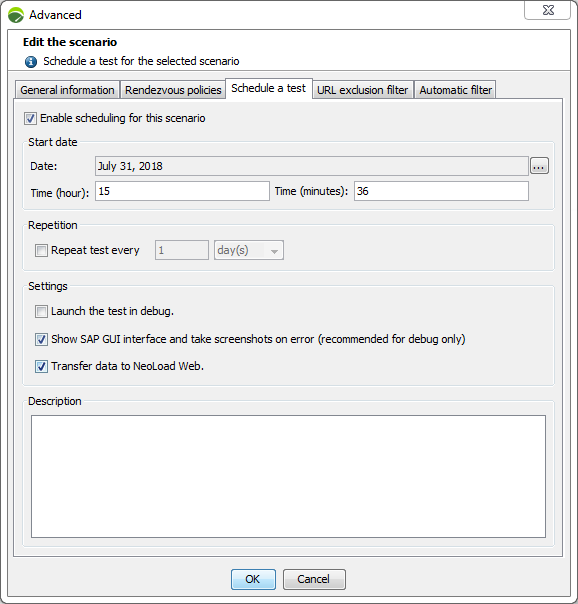
To schedule a test, follow these steps:
-
Select the scenario to be run.
-
Click on the Advanced button.
-
Select the Schedule a test tab.
-
Check the Enable scheduling for this scenario check box.
-
Select a date and time.
-
Enter a repeat rule (optional).
-
Schedule the test in debug mode (optional).
-
For SAP tests, you can decide to show the SAP GUI interface to take screenshots on error.
-
Send to NeoLoad Web the data related to the test (optional).
-
Enter a test description (optional).
-
Click OK.
Note: NeoLoad must be running at specified time to be able to run the tests.
URL exclusion filter
Requests whose URL corresponds to one of the regular expressions in the exclusion filter are excluded from the scenario and are ignored during the test playback. Likewise, the resulting empty pages and Containers will be deleted.
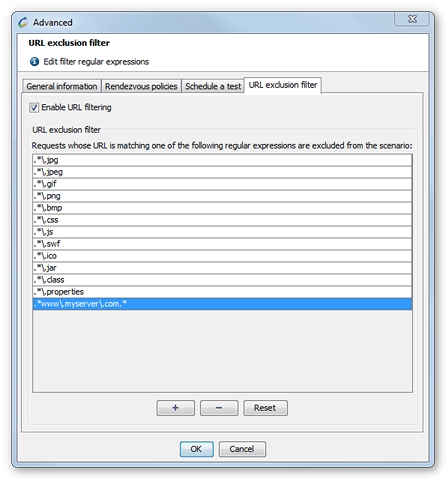
A filter can help exclude the requests whose URL corresponds to a file type or a portion of the application. For example, the filter .*www\.myserver\.com.* makes it possible to ignore all the requests sent to the server www.myserver.com from the test playback.
Automatic filter
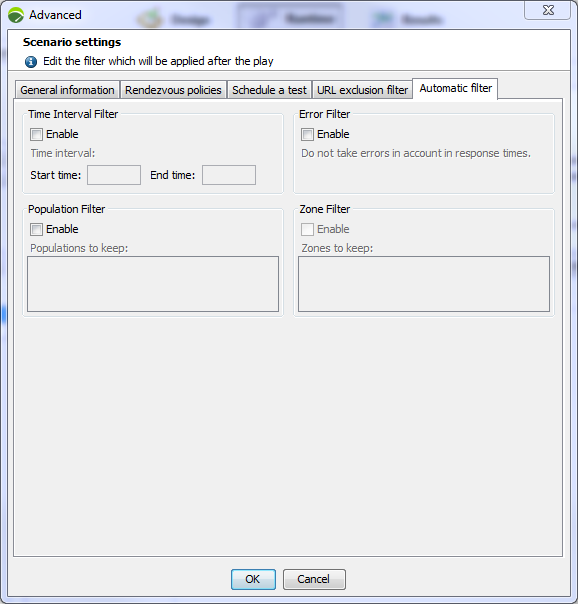
The Automatic filter tab allows you to apply a filter to the selected test results according to different criteria.
For more information, see Filter test results.
APM
NeoLoad enables you to configure custom metrics for the monitoring of projects with Dynatrace. The Monitoring tab is displayed in the Scenario advanced settings of NeoLoad when the integration of Dynatrace is enabled.
To be able to monitor a NeoLoad project with Dynatrace, you need to configure the integration with Dynatrace beforehand in Edit > Preferences > Project settings > Dynatrace.
For more information, see Enable the Integration of Dynatrace.
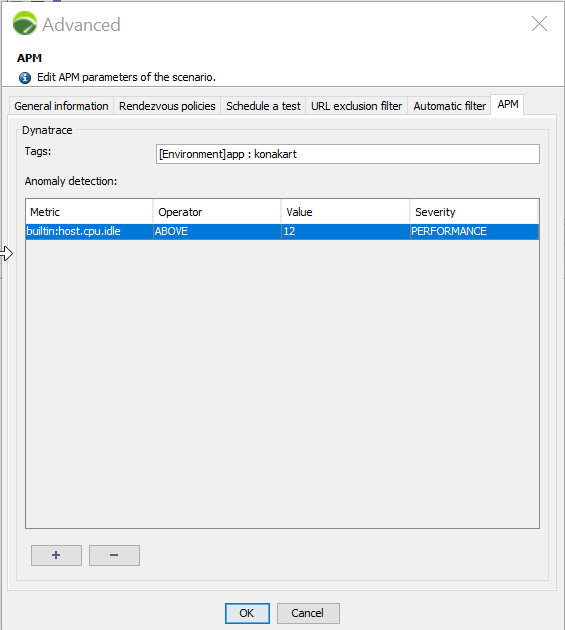
In the Tags field, you can enter the list of the services to be monitored by Dynatrace (format is comma-separated list: tag1,tag2). It will link the NeoLoad computed data to Dynatrace tags.
In the Anomaly detection section, you can define rules so that Dynatrace will be able to detect anomalies during the test.
Note: All rules created at the beginning of the test are automatically deleted at the end of the test.
An alert, with the user-specified severity, is triggered when the condition set by the user and the threshold value is matched. For example, in the screenshot above, a PERFORMANCE alert is triggered when the value of the Idle metric is greater than or equal to 12.
Note: The alerts triggered during the test can be viewed in the Problems section of the Dynatrace interface.