Runtime alerts
Alert details may be obtained while the test is running. Click on the Refresh button to display the latest alert occurrences.
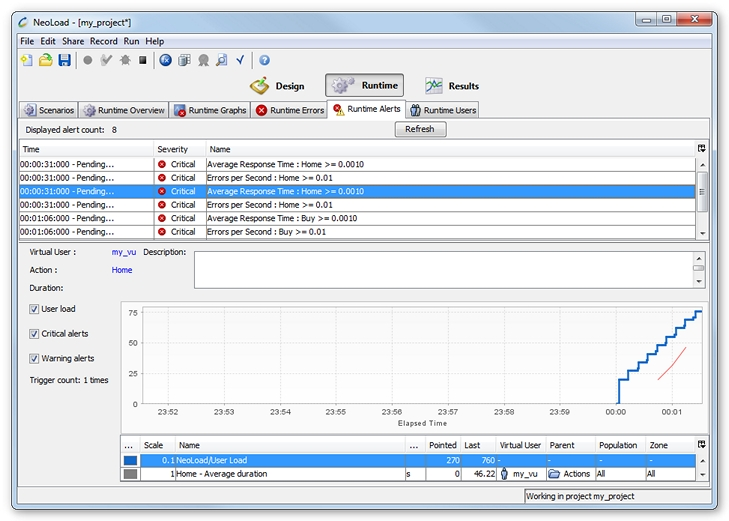
Alert Table
-
Time. Alert start and end time, relative to the test start time.
-
Severity. Alert severity level.
-
Name. Alert name. The name comprises the corresponding performance counter name plus a text description of the alert threshold.
Alert details
Select an alert to obtain the following details:
-
Parent. Name of the element parent. When the element is a performance counter, this is the name of the monitored machine that triggered the alert.
-
Element. Name of the element that triggered the alert. When the element is a performance counter, this is the name of the Monitor that triggered the alert.
-
Duration. Alert duration.
-
Description. Alert description.
-
Delay trigger. Delay trigger for the alert threshold.
Alert graphs
When an alert is selected in the table, the graph displays all the alerts relating to the same performance counter: a red zone for critical alerts and a yellow zone for warning alerts. The zone corresponding to the selected alert is shown in a slightly darker color.
The alert threshold values are represented by a horizontal dotted line.
Tip: Click on an alert zone to select the corresponding entry in the table.
Graph Options
Check the following boxes to display the corresponding elements:
-
User Load. Displays the user load.
-
Critical Alerts. Displays the thresholds and zones indicating critical-level alerts.
-
Warning Alerts. Displays the thresholds and zones indicating warning-level alerts.