Prometheus
Create a Prometheus monitor
NeoLoad makes it possible to create a new monitor either using the monitored machine creation wizard, as described in Configure a monitored machine, or from an existing monitored machine, as described in Create and configure a monitor:
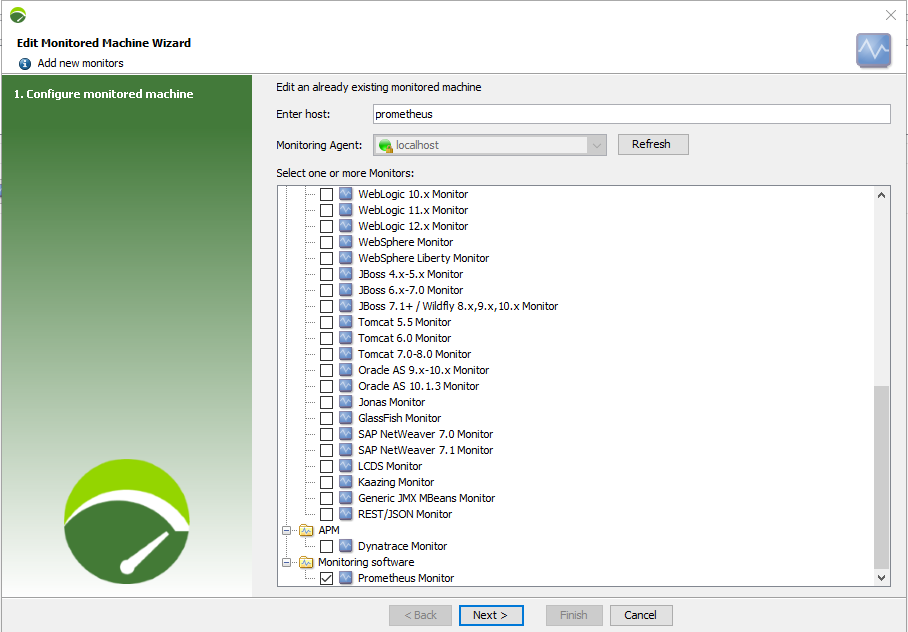
This configuration enables NeoLoad to connect to Prometheus in order to display and graph the metrics collected by Prometheus.
Additional properties
Additional properties are available for Prometheus monitors. They determine how the counter values are calculated and sampled.
-
Monitoring interval
It is the frequency at which metrics are to be retrieved.
-
Step between points
Interval of time between 2 samples
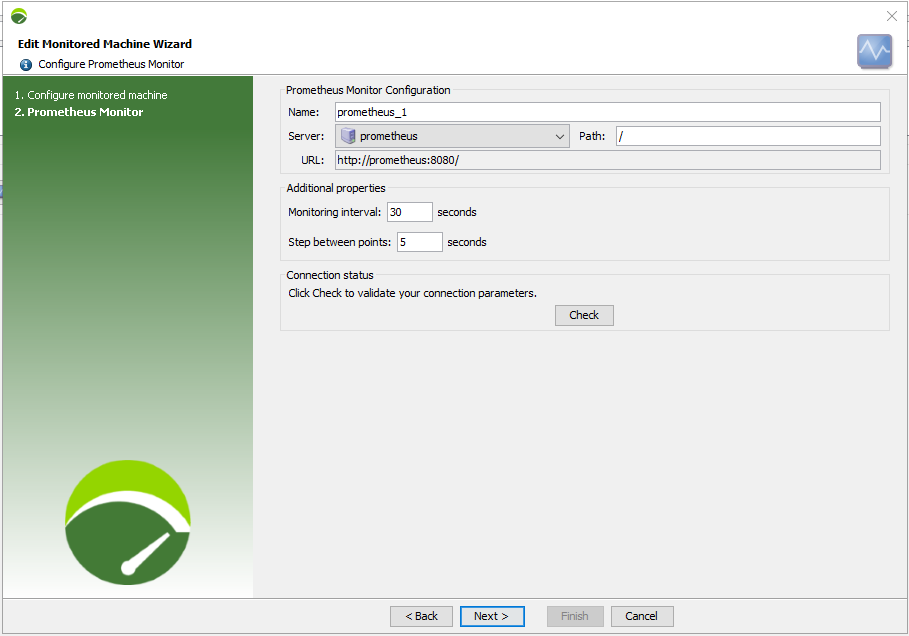
In the configuration showed in the screenshot above, we'll get 6 points every 30 seconds.
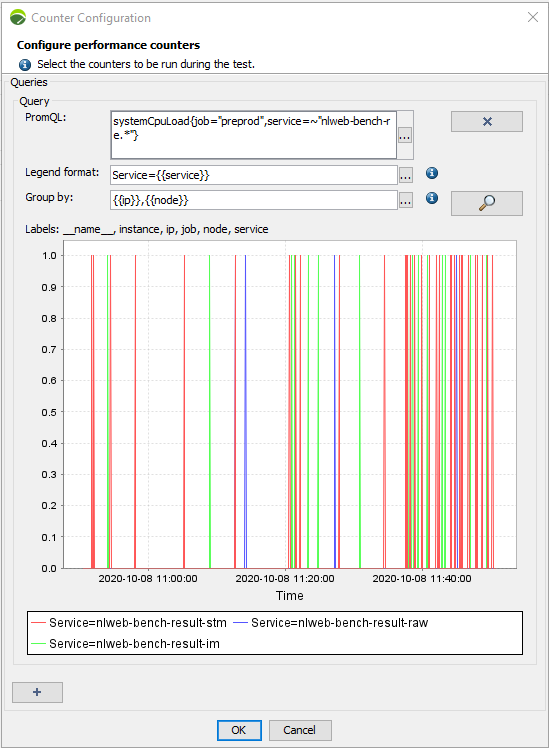
Queries
This step enables to configure queries on the Prometheus server and test them by displaying the matching graph for the last hour.
You can add as many queries as you want using the  button and delete a query with the
  button.
In the PromQL field, type your query using Prometheus language.
In the Legend format field, enter the name you want to give to the curve and the name of the corresponding counter.
The Group by field enables you to decide how the tree will be displayed in the results.
In each of those 3 fields, you can click on the ellipsis button  to pick a NeoLoad variable.
The configuration of the counters of the Prometheus monitor allows you to define a query from an as-code file containing variables.
You can use the labels stated just above the simulation graph between double curly brackets to replace the labels by their values in the:
-
names of the curves of the graph (Legend format field)
-
monitor graph tree (Group by field)
The graph and its legend display the results of the query typed in the PromQL field, here we have 3 results, 3 curves and the name of each curve.
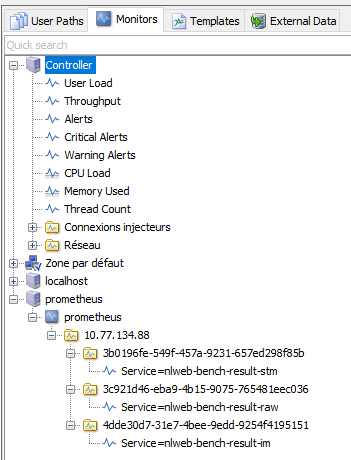
Monitor graphs
The PromQL query displayed in the screenshot above results in this tree in the Results > Graphs > Monitors section of NeoLoad.
Dynamic counters
If new counters are identified by Prometheus during the test, they are displayed in the Results graphs ofNeoLoad GUI and NeoLoad Web.