Microsoft Windows
Definition
The Microsoft Windows monitor allows to check the operating system of Microsoft Windows servers: CPU, memory, disk, network, etc.
Microsoft monitors use a Windows API to list and query performance counters, namely the Performance Data Helper (PDH) library used by Perfmon which is a Windows tool. Therefore, the NeoLoad Microsoft monitors have the same characteristics and constraints as Perfmon:
-
Monitoring is done without installing any additional component, which obviates the installation of a specific client on the machine to be monitored.
-
The monitoring of Microsoft servers is only possible using Windows monitoring agents. Microsoft servers cannot be monitored with a Unix/Linux monitoring agent.
-
The user account associated with the monitored machine must have the appropriate user rights. For more information, see Connect to a remote server.
When defining a counter, and depending on the type of counter, one or more instances may be also selected. One instance corresponds to a certain sub-division of the monitored object. For example, Processor/Processor Time % has several instances, one for each processor present in the monitored machine. Usually, an instance named _Total allows retrieving an average value across all available instances.
Note: Instances of the Process category are labeled with following convention: processName_processId.
Note: Instances of the Thread category are labeled with following convention: processName_processId/threadId.
Connect to a remote server
To connect to a remote server, it is mandatory to perform the following operations:
-
Assigning the appropriate rights to the user account associated with the monitored machine. For more details, see Performance Monitor Users below.
-
Enabling the File and printer sharing option in Windows. For more information, see File and printer sharing below.
-
Starting the Remote Registry service on the remote monitored machine. For more details, see Remote Registry below.
-
Configuring the firewall settings as described in Firewall settings below.
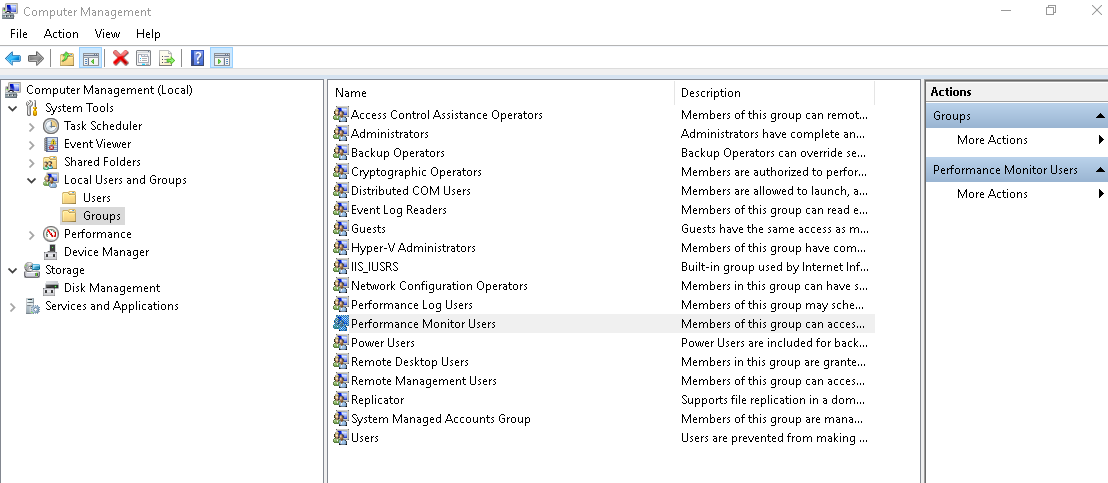
Performance Monitor Users
To access a remote machine, the user account associated with the monitored machine (or NeoLoad for the built-in agent) must have the user rights required to remotely monitor a server. The authorizing rights are provided for administrators and members of the Performance Monitor Users Windows group on the server being monitored.
For more information about configuring the Performance Monitor Users group in Windows, refer to the image below
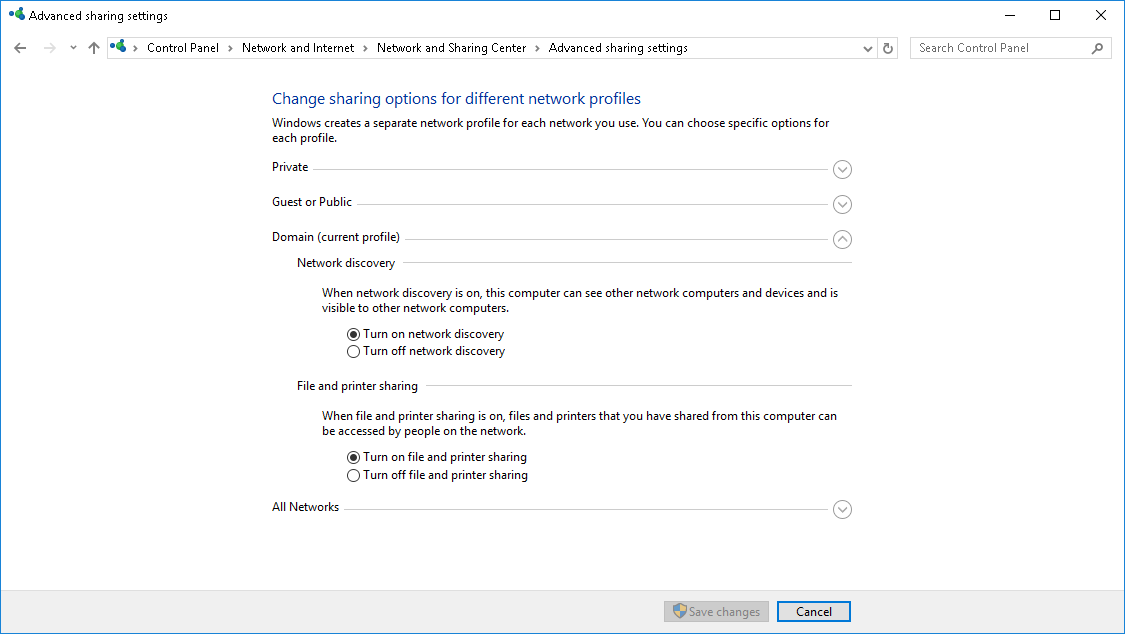
File and printer sharing
Enable the option in Windows as illustrated in the image below.
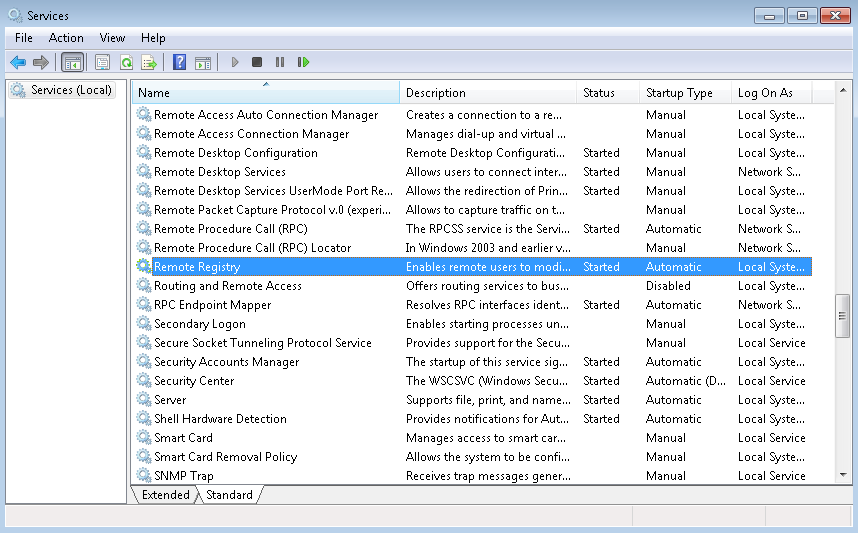
Remote Registry
Start the service on the remote monitored machine as illustrated below.
Firewall settings
TCP Port 445 and TCP Port 139 must be open on firewalls. For the Windows firewall, this can be done by adding an exception for "File and printer sharing".
Create a Windows monitor
NeoLoad makes it possible to create a new monitor either using the monitored machine creation wizard, as described in Configure a monitored machine, or from an existing monitored machine, as described in Create and configure a monitor:
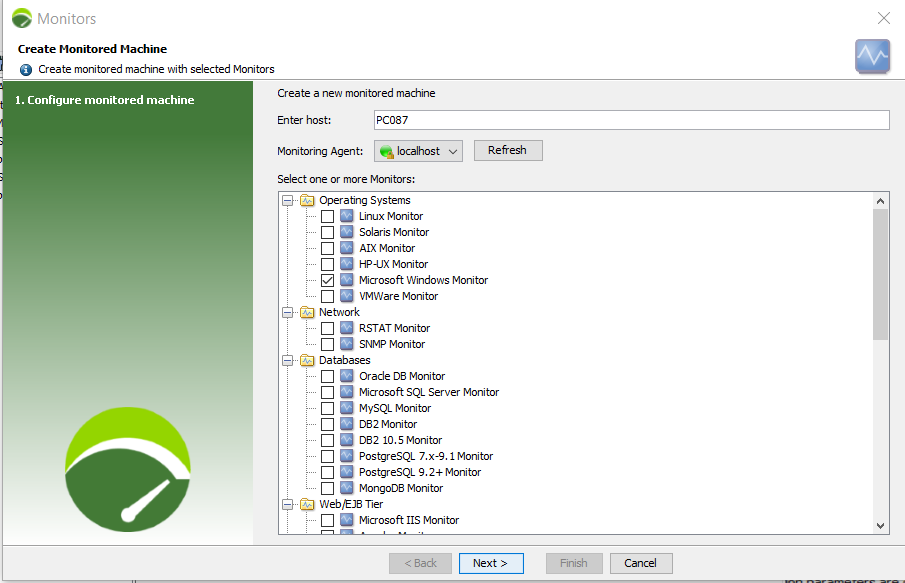
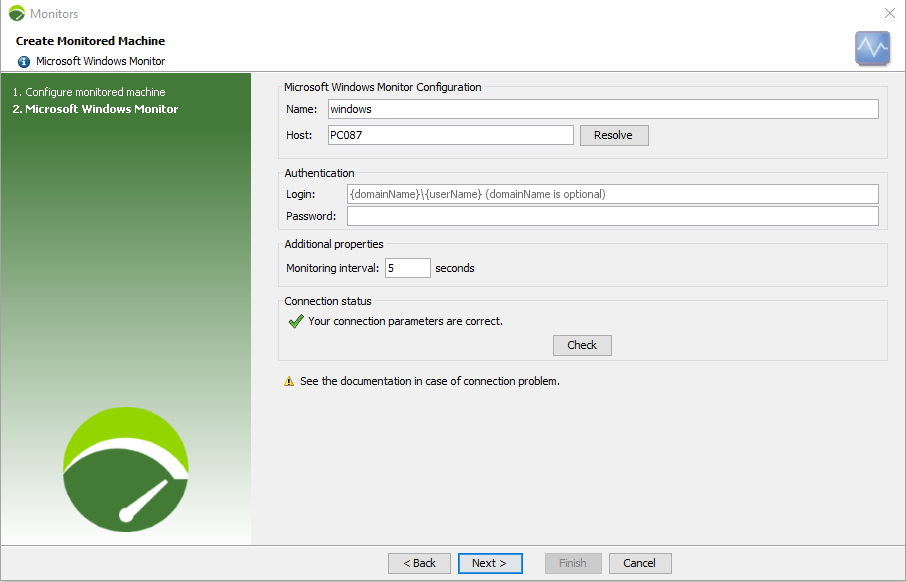
Name: Visual name used to represent the monitor in NeoLoad.
Host: Machine physical name (hostname or IP address).
Note: If you don't know the machine name, you can just type the IP address and click Resolve. The IP is then automatically replaced with the name.
Login: The user account login associated with the monitored machine. When the domain name is to be specified (optional), the format must be: "{domainName}\\{userName}".
Caution: The login must relate to a user belonging to the Performance Monitor Users group or the Administrators group on the computer from which you want to retrieve monitoring data. Otherwise, no Windows Performance Monitor data is collected. For more information, see Connect to a remote server.
Password: The password associated with the login entered in the Login field.
Monitoring interval: This refers to the interval between two monitor value readings for that connection. The recommended default interval is 5 seconds. Too short an interval could have a negative effect on the server performance.
The Check button allows testing the connection to the server. If it fails, it is necessary to check the monitor settings. A specific error message helps identify the possible cause of the connection failure. Pressing F1 gives a list of prerequisites for each type of monitor.
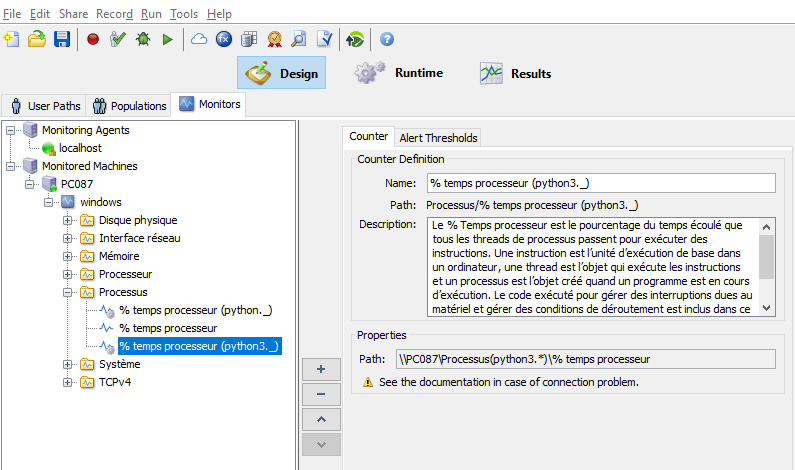
Available counters
On a typical Windows server, the main, basic counters are as follows:
-
Memory\Pages/sec. Detects the Pages/sec swap rate. The pages/sec rate is the speed at which the pages are read from or written to the disk when resolving hardware page faults. A hardware page fault occurs when a process has to access code on a physical disk because it cannot be accessed in the memory.
-
Memory\Available Megabytes. Indicates how much physical memory remains after the working sets of running processes and the cache have been served. Should be greater than 10% of the physical memory.
-
Processor\Processor Time \%. CPU activity in percentage.
-
System\Processor Queue Length. This counter displays the number of threads waiting to be executed in the queue that is shared by all processors on the system. If this counter (divided by the number of processors) has a sustained value of five or more threads, there is a processor bottleneck.
-
Physical disk\Disk Time \%. Percentage of elapsed time spent by the selected physical disk drive executing read or write requests. More than 55% for continuous periods indicates a bottleneck.
-
Network Interface\Packets/s. Rate at which packets are sent and received on the network interface.
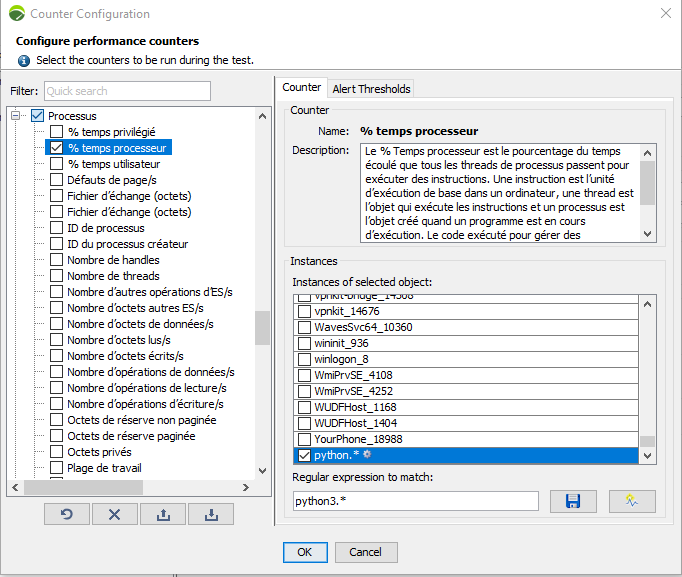
Instances based on regular expressions
On top of the list of available counters and instances you can choose from when you design a Microsoft monitor, NeoLoad enables you to configure regular expressions.
Note: Counters with regular expressions are indicated with this specific icon  to show that they are dynamic.
In the Instances section, enter a new regular expression to match in the blank field and click the  Create button to add this new regular expression to the list.
If you need to modify an existing regular expression, select it in the list of Instances of selected objects, the selected regular expression is then displayed in the blank field in the bottom of the screen so that you can bring your modifications and click the  Save button to save it to the list.
This configuration will result in creating counters that will monitor all instances matching the regular expression(s) added.