Step by Step Debug
The Step by step debug mode gives you more control during debugging and allows you to fix issues right when they occur during test runs. For example, it's easier to debug a RealBrowser User Path because you can block the browser in its current state, which gives you time to understand and fix the issue right then, instead of spending double the effort on investigations later.
The Step by step debug activates automatically on any RealBrowser action if an error is encountered in Check a user path and Record here.
Supported actions
By default, the Step by step debug is triggered in Install RealBrowser. Additionally, it is available for the following actions:
-
Third-party actions that leverage the CustomAction API
To extend Step by step debug to these actions, open the configuration file controller_user.properties and set step.debug.for.all.custom.actions.feature.toggled=false to true.
Debug during execution
If NeoLoad encounters an error while in CheckVU or Record Here, it displays an error message.
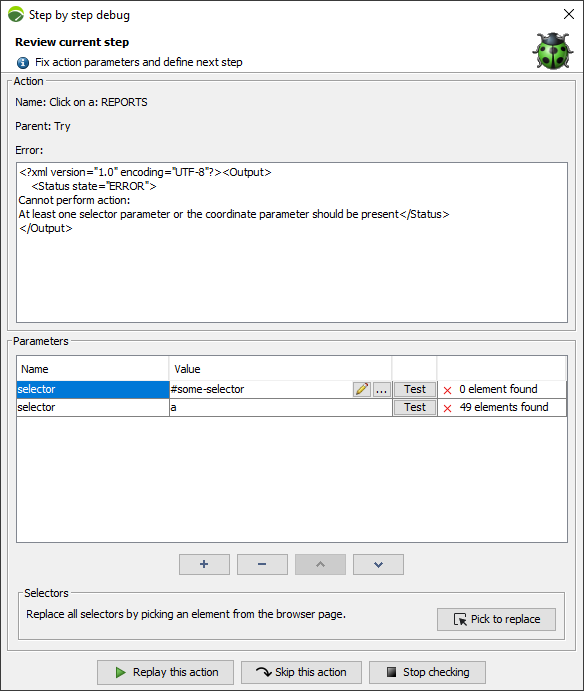
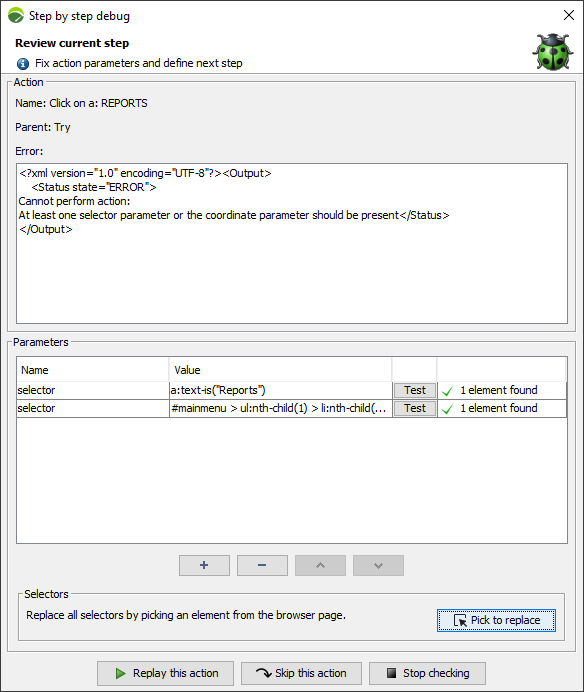
Selectors need to be unique so that it is clear what to test. If it's not possible to find a selector on the page, or there is more than one, the action fails. In this case, the Step by step debug dialog displays the error to help you find and replace the inaccurate selectors. After debugging the step, click Replay this action to verify the fix.
Some errors may not be recoverable, for instance if the browser crashes in RealBrowser. Or you may not find the right solution during debugging. In this case, click Skip this action and continue despite the error. The next action depends on the error policy of the current container. For instance:
-
In a Try/Catch block with "catch errors" options set to True, the next action is the one in the catch block.
-
In a Try/Catch block with “catch errors” options set to False, or set outside a Try/Catch block, the next action is the one in the queue.
Alternatively, click Stop checking to terminate the current virtual user execution and finish the Check VU or Record Here process.
Note: Check User Path stops when you close the dialog.
Breakpoints
Breakpoints are a tool that can be employed with all types of Custom Actions for debugging and analyzing the behavior of test scripts and applications in NeoLoad, especially useful in RealBrowser, where you can inspect the browser state using the developer tools.
By pausing script execution at specific points, you can examine variables, server responses, and the internal state of the application.