Enable and work with Dynatrace
Enable the Dynatrace integration
You can enable the integration in the following ways:
To enable the integration of Dynatrace and NeoLoad, you need to perform some steps in Dynatrace first.
You need to manually put a tag on a Dynatrace service at the traffic entry point of your application, typically your web front servers or proxies. From there, the integration will auto-tag all connected hosts, services and processes in the Dynatrace smartscape.
At the end of the run, NeoLoad cleans up the whole tag configuration.
To enable the Dynatrace integration at the project level, follow these steps:
-
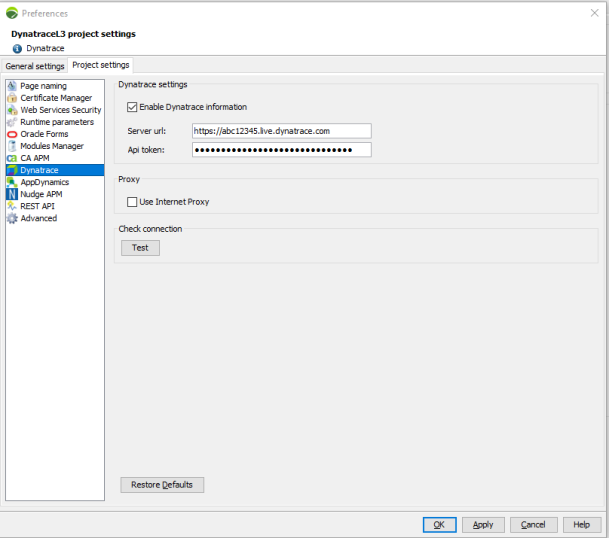
In the NeoLoad menu bar, click Edit > Preferences > Project settings > Dynatrace.
-
Select Enable Dynatrace information.
-
In the Server url field, enter the identifier of the tested Dynatrace environment:
-
For live environments, the url looks like: https://<identifier>.live.dynatrace.com
Example:
https://abc12345.live.dynatrace.com -
For managed environments, the url looks like https://<hostname>/e/<identifier>
Example:
https://dynatrace.myCompany.com/e/abc12345
Tip: If you work with an on-premise Dynatrace deployment with self-signed certificate, you may encounter SSL certificate error messages that can be fixed with quite a lot of configuration. To ease the process and be able to work with self-signed on-premise instances, you may set the property stated below to true. In the installation directory of NeoLoad, in <install-dir>/conf/controller.properties [General]dynatrace.tls.insecure=true
4. In the Api token field, enter the API key of your Dynatrace account that you created (or retrieved) from menu Settings/Integration/Dynatrace API of the Dynatrace interface.
5. If you need a proxy to go to Dynatrace, you can configure a proxy in the NeoLoad General settings by clicking the Proxy configuration in the general settings link. See Use a proxy for more details.
Deprecate note: the checkbox Use Internet Proxy is deprecated, please uncheck it and configure the Dynatrace proxy in the NeoLoad General settings for all your Controllers.
The following access scopes must be defined for your token to have full access to all Dynatrace integration functions:
- Read metrics to access problem and event feed, retrieve metrics and review topology
- Capture request data to identify traffic
- Read configuration to create anomaly detection rules
- Write configuration to create anomaly detection rules
- Read entities to retrieve entities to monitor
- Write entities to delete the tags created by NeoLoad at the end of the test
- Ingest events to send events to related services
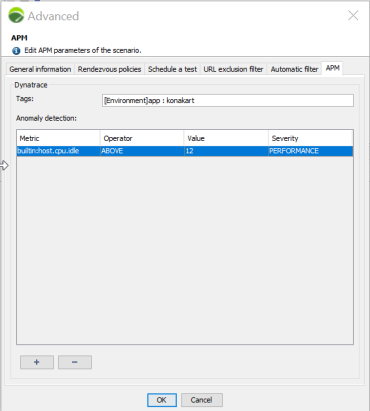
To enable the Dynatrace integration at the scenario level, you need to specify the tag that has been set on the Dynatrace service at the traffic entry point of your application.
It allows you to manage several applications (with different tags) in the same NeoLoad Project in different scenarios.
NeoLoad will monitor the Dynatrace entities of "Service"-type that have at least ALL tags specified in the Tags field of the APM tab meaning that a "AND" operation is applied on the list of tags. It will then monitor all entities of "Host"- and "Process group"-types connected to the "Services" mentioned above, monitored in the Dynatrace smartscape. To keep the test result readable, 350 entities at most can be monitored during the test. You must set tags to match this number of entities.
Note: The colon ":" character is reserved by Dynatrace to name tags created automatically. They must be avoided in manual tags. If you still want to create a manual tag in Dynatrace containing the colon ":" character, you will need to specify "\:" in the Tags field of your NeoLoad scenario.
Example:
| Automatic tag in Dynatrace: app:front-end | In NeoLoad: app:front-end |
| Manual tag in Dynatrace: app:front-end | In NeoLoad: app/:front-end |
Monitoring
Note: There is a 2-minutes time lag between the end of the test and the retrieval of all metrics in the NeoLoad interface.
Monitoring is enabled by creating a Monitor (see Create a Dynatrace monitor for more information) and by choosing the metrics you want to monitor.
For monitoring to take place, you need to:
-
enter the identifier of the tested Dynatrace environment and the API key of your Dynatrace account as documented in Enable and work with Dynatrace.
-
configure at least one tag in the Tags field of the APM tab of your Scenario advanced settings as documented in Enable the integration of Dynatrace In the NeoLoad scenario.
Note: Specify tags on the Dynatrace services that you want to monitor.
The Dynatrace entities that will be monitored and for which metrics will be retrieved are: all services, processes and hosts that are at 3 levels of depth of each service specified with a tag.
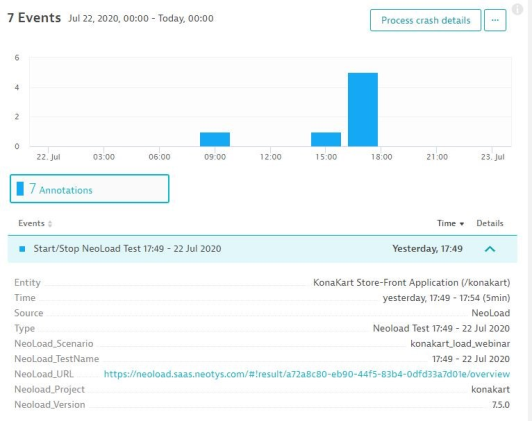
Send events to Dynatrace services
At the end of the test, an event is sent to each monitored service of Dynatrace.
Send metrics to Dynatrace
NeoLoad sends global statistics of the test to Dynatrace so that they can be used as custom metrics in Dynatrace dashboards.
These metrics are:
-
User Load (number of virtual users)
-
Downloaded Bytes (number of bytes downloaded)
-
Downloaded Bytes Rate (number of bytes downloaded per second)
-
Rate (number of requests per second)
-
Transaction Rate (number of transactions per second)
-
Number of failures
Dynatrace integration from as-code
You can override the project settings of the Dynatrace integration with as-code yaml files.
For more information, please refer to the Project settings GitHub documentation.
You can also override the Scenario advanced settings of the APM tab with as-code yaml files.
For more information, please refer to the APM Configuration GitHub documentation.
Because Monitors cannot be created from as-code, you need to load a project containing at least one Dynatrace Monitor.
Identify NeoLoad traffic
To identify the traffic created in Dynatrace, NeoLoad adds a header in the requests it sends. This allows you to easily isolate the traffic coming exclusively from NeoLoad.The following request attributes are automatically created:
| Header property | Request attribute name in Dynatrace | Value |
|---|---|---|
| PC | NeoLoad_ Requests | The name of the Page |
| SN | NeoLoad_ScenarioName | The name of the User Path |
| NA | NeoLoad_Transaction | The path to the Transaction |
| GR | NeoLoad_Zone | The zone of the Load Generator |
You can also create your own request attributes to filter the traffic with more granularity:
| Header property | Value |
|---|---|
| SI | The value is always NeoLoad |
| VU | The ID of the Virtual User that executes the request |
| ID | The unique ID of the request. It remains constant for the same request in the same zone and same population. It is different for each request of the design. |
| TE |
The project name, followed by the scenario name then the Test Result ID. These three are separated by a dash |
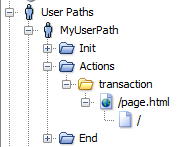
Example: A header to sent to Dynatrace for the request "/" could be: X-Dynatrace-Test: SI=NeoLoad;VU=0;SN=MyUserPath;PC=/page.html;ID=8;NA=Actions.transaction.;GR=Default zone;TE=Sample_Project-scenario1-09aab63a-bf17-4505-9d70-f6c267055b89
Dynatrace is compatible with Real Browser traffic tagging. When you enable Dynatrace integration, the header X-Dynatrace-Test is sent for all browser based requests. The header value is the same as protocol requests, except for:
-
PC, which is empty.
-
ID, which is empty.
-
NA, which is empty.
Define anomaly rules
You have the option of having Dynatrace detect anomalies during the test. To that end, you need to define anomaly rules in NeoLoad.
For more information, please refer to the documentation of the APM section in the APM tab of your Scenario advanced settings.