View Datasets - Comparison results
When a Compare View action is run, the associated View dataset is populated with comparison results for each of the table views compared. View datasets have the following structure:
<Dataset Name> (View Dataset)
<Table 1>
<Table N>
Entities
 <Dataset
name> (View Data Set)
<Dataset
name> (View Data Set)
When the root object is selected from View dataset that contains comparison results, the Details pane displays a comparison summary for each of the table views compared.
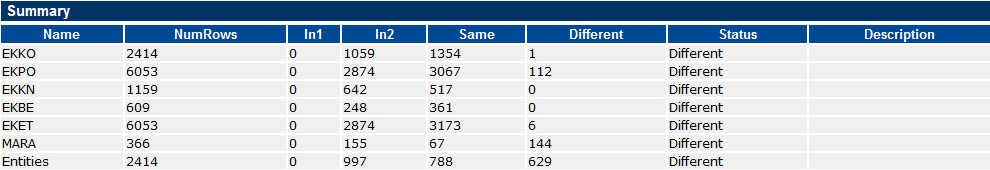
The summary shows the number of rows retrieved for each table view in the dataset, the number of rows that are the same or different in each of the compared systems, and the number of rows that exist in one system only. ‘In1’ and ‘In2’ refer to the first and second RFC Destinations specified in the Retrieve View action.
The Details pane also includes a summary for each individual table view in the dataset. This summary indicates the number of field values found to be different when the table views were compared (note that in the following screen shot, not all the table columns are shown).

 Tables
The View dataset contains a Table object for each table alias in the View Definition where the usage type is set to MAIN. Each object has the name of the corresponding SAP table. If a table has more than one alias, the table object shows each alias name in square brackets.
If the View dataset contains comparison results, each Table object is marked with an icon to indicate its comparison status:
| Icon | Description |
|---|---|
|
|
The table view is the same in each of the compared systems. |
|
|
The table view is different in each of the compared systems. |
|
|
The table view exists in the first compared system only. |
|
|
The table view exists in the second compared system only. |
When a table object is selected in a View dataset, the Details pane displays a grid control showing the compared values in the table view. The columns in the grid control may be resized by dragging the resize handles in the column headings. With the exception of the first column, a column may be expanded or contracted by double-clicking the handle on its right.
The grid control has column headings for each of the table fields compared, and two additional columns. The first column indicates the comparison status for the row, and the second column contains the SAP System ID for each of the compared systems.
Row data is matched based upon the ID Columns specified for the table view in the associated View Definition. These columns are marked with ‘*’ in the grid control. If the table view includes columns from an additional table (specified using an ‘Add’ section in the View Definition), the additional columns are marked with ‘+’.
The grid control uses the following display conventions:
- If a row is shaded in cyan,
the row data exists in the first compared system only. Its RFC Destination
is shown in the System column, and the comparison status column has the
value
 .
. - If a row is shaded in pink,
the row data exists in the second compared system only. Its RFC Destination
is shown in the System column, and the comparison status column has the
value
 .
. - If a row is unshaded, the row
data is the same in each of the compared systems. The System column is
left blank, and the comparison status column has the value
 .
. - If the comparison status column
contains the value
 , the row data is different in each of the compared
systems. Field values are displayed from each of the compared systems.
Values that are different are shown in red with a yellow background, values
that are the same are shown in black with an unshaded background.
, the row data is different in each of the compared
systems. Field values are displayed from each of the compared systems.
Values that are different are shown in red with a yellow background, values
that are the same are shown in black with an unshaded background. - Values shaded in green indicate key fields.
- Selected cells are shaded in gray.
Click a link in the comparison status column to open the Row Details screen, which displays field values and descriptions for the selected row.
Entities
The View dataset includes a single Entities object which links each of the tables in the dataset according to the parent-child relationships specified in the View Definition. The Entities object is marked with an icon to indicate its overall comparison status.
When the Entities object is selected, the Details
pane displays a grid control showing the rows compared in the parent table
specified in the View Definition. The grid control uses the display conventions
described above, and additionally the ![]() icon, which indicates that a row has differences
only in its child records. These rows are shown with a yellow background.
icon, which indicates that a row has differences
only in its child records. These rows are shown with a yellow background.
Click a link in the comparison status column to display the Row Details screen. This displays the selected row from the parent table and any related rows from each of the child tables.
A range of cells may be selected in the grid control by using Left Click+Drag in the column headings, row headings or table body. Alternatively, use Shift+Arrow keys to select cells using the keyboard. To select the entire table, choose ‘Select All’ from the grid control’s context menu. To clear a selection, choose ‘Clear All’ from the context menu, or click the cell labeled # in the top left-hand corner of the grid control. The following keyboard shortcuts may also be used
- Page Up scrolls the display up by one page.
- Page Down scrolls the display down by one page.
- Home selects the first cell in the current row.
- End selects the last cell in the current row.
- Ctrl+Home selects the first cell in the current column.
- Ctrl+End selects the first cell in the current column.
To export the selection to an Excel spreadsheet, choose ‘Copy Selection to Excel’ from the grid control’s context menu. To copy the selection to the Windows Clipboard, choose ‘Copy’ from the context menu, or press Ctrl+C. If a column is selected, all the column rows are copied, not just the rows that have been loaded into the grid control.
To export the selection to an Excel spreadsheet, choose ‘Export Selection to Excel’ from the grid control’s context menu.
 Options
Click the ‘Options’ icon to show or hide the Options dialog:
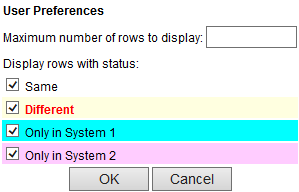
Enter a maximum number of table rows to display in the ‘Maximum number of rows to display:’ field. This value applies to all tables viewed by the current user, and is also stored in the ‘Maximum number of rows/objects to display:’ User preferences field.
Select the appropriate check boxes in the ‘Display rows with status:’ section to display only those table rows with the selected comparison statuses. Each LiveCompare user may have their own settings, but the settings apply to all table comparison views.
Click ‘OK’ to save your changes.
 Export to
Excel
Export to
Excel
Click the ‘Export to Excel’ icon to export the contents of the selected Table or Entities object to an Excel spreadsheet named <Table Name>_<YYYYMMDD_HHMMSS>.xls or Entities_<YYYYMMDD_HHMMSS>.xls.